Albanian vs Immigrants from Latvia Receiving Food Stamps
COMPARE
Albanian
Immigrants from Latvia
Receiving Food Stamps
Receiving Food Stamps Comparison
Albanians
Immigrants from Latvia
12.0%
RECEIVING FOOD STAMPS
35.4/ 100
METRIC RATING
187th/ 347
METRIC RANK
10.3%
RECEIVING FOOD STAMPS
96.8/ 100
METRIC RATING
103rd/ 347
METRIC RANK
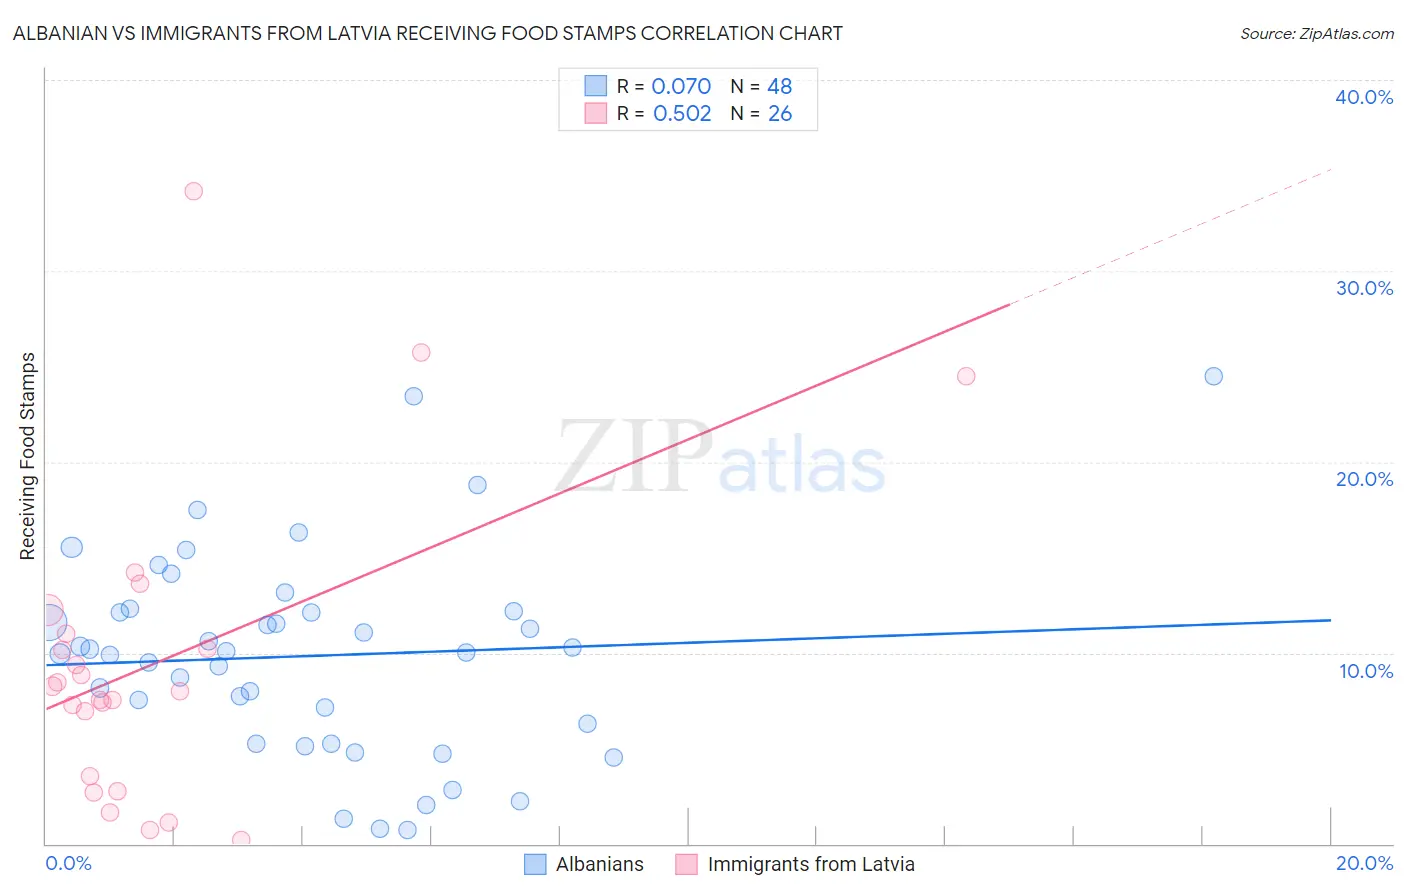
Albanian vs Immigrants from Latvia Receiving Food Stamps Correlation Chart
The statistical analysis conducted on geographies consisting of 192,875,347 people shows a slight positive correlation between the proportion of Albanians and percentage of population receiving government assistance and/or food stamps in the United States with a correlation coefficient (R) of 0.070 and weighted average of 12.0%. Similarly, the statistical analysis conducted on geographies consisting of 113,573,789 people shows a substantial positive correlation between the proportion of Immigrants from Latvia and percentage of population receiving government assistance and/or food stamps in the United States with a correlation coefficient (R) of 0.502 and weighted average of 10.3%, a difference of 15.9%.
Receiving Food Stamps Correlation Summary
| Measurement | Albanian | Immigrants from Latvia |
| Minimum | 0.70% | 0.20% |
| Maximum | 24.5% | 34.2% |
| Range | 23.8% | 34.0% |
| Mean | 9.8% | 9.5% |
| Median | 10.0% | 8.1% |
| Interquartile 25% (IQ1) | 5.8% | 3.5% |
| Interquartile 75% (IQ3) | 12.2% | 11.0% |
| Interquartile Range (IQR) | 6.4% | 7.5% |
| Standard Deviation (Sample) | 5.3% | 8.0% |
| Standard Deviation (Population) | 5.2% | 7.8% |
Similar Demographics by Receiving Food Stamps
Demographics Similar to Albanians by Receiving Food Stamps
In terms of receiving food stamps, the demographic groups most similar to Albanians are Spanish (12.0%, a difference of 0.22%), Immigrants from Iraq (12.0%, a difference of 0.25%), Sudanese (12.0%, a difference of 0.31%), Immigrants from Cameroon (12.0%, a difference of 0.44%), and Immigrants from Peru (12.0%, a difference of 0.50%).
| Demographics | Rating | Rank | Receiving Food Stamps |
| Uruguayans | 44.8 /100 | #180 | Average 11.8% |
| South American Indians | 41.7 /100 | #181 | Average 11.9% |
| Immigrants | Morocco | 40.7 /100 | #182 | Average 11.9% |
| Immigrants | Uganda | 40.3 /100 | #183 | Average 11.9% |
| Spaniards | 39.8 /100 | #184 | Fair 11.9% |
| Immigrants | Iraq | 37.1 /100 | #185 | Fair 12.0% |
| Spanish | 36.9 /100 | #186 | Fair 12.0% |
| Albanians | 35.4 /100 | #187 | Fair 12.0% |
| Sudanese | 33.4 /100 | #188 | Fair 12.0% |
| Immigrants | Cameroon | 32.5 /100 | #189 | Fair 12.0% |
| Immigrants | Peru | 32.2 /100 | #190 | Fair 12.0% |
| Venezuelans | 32.1 /100 | #191 | Fair 12.0% |
| Samoans | 31.0 /100 | #192 | Fair 12.1% |
| Immigrants | Fiji | 27.8 /100 | #193 | Fair 12.1% |
| Immigrants | Sudan | 27.1 /100 | #194 | Fair 12.1% |
Demographics Similar to Immigrants from Latvia by Receiving Food Stamps
In terms of receiving food stamps, the demographic groups most similar to Immigrants from Latvia are Immigrants from Hungary (10.3%, a difference of 0.010%), Immigrants from Europe (10.3%, a difference of 0.10%), Immigrants from Western Europe (10.3%, a difference of 0.18%), Palestinian (10.3%, a difference of 0.18%), and Serbian (10.3%, a difference of 0.31%).
| Demographics | Rating | Rank | Receiving Food Stamps |
| Welsh | 97.3 /100 | #96 | Exceptional 10.3% |
| Czechoslovakians | 97.2 /100 | #97 | Exceptional 10.3% |
| Immigrants | Egypt | 97.1 /100 | #98 | Exceptional 10.3% |
| Serbians | 97.0 /100 | #99 | Exceptional 10.3% |
| Immigrants | Western Europe | 96.9 /100 | #100 | Exceptional 10.3% |
| Palestinians | 96.9 /100 | #101 | Exceptional 10.3% |
| Immigrants | Europe | 96.8 /100 | #102 | Exceptional 10.3% |
| Immigrants | Latvia | 96.8 /100 | #103 | Exceptional 10.3% |
| Immigrants | Hungary | 96.7 /100 | #104 | Exceptional 10.3% |
| Immigrants | Malaysia | 96.5 /100 | #105 | Exceptional 10.4% |
| Immigrants | Italy | 96.4 /100 | #106 | Exceptional 10.4% |
| Koreans | 96.3 /100 | #107 | Exceptional 10.4% |
| Carpatho Rusyns | 96.2 /100 | #108 | Exceptional 10.4% |
| Immigrants | Pakistan | 96.2 /100 | #109 | Exceptional 10.4% |
| Pakistanis | 95.9 /100 | #110 | Exceptional 10.4% |