Peruvian vs Tlingit-Haida Male Poverty
COMPARE
Peruvian
Tlingit-Haida
Male Poverty
Male Poverty Comparison
Peruvians
Tlingit-Haida
10.7%
MALE POVERTY
87.1/ 100
METRIC RATING
121st/ 347
METRIC RANK
10.9%
MALE POVERTY
76.1/ 100
METRIC RATING
140th/ 347
METRIC RANK
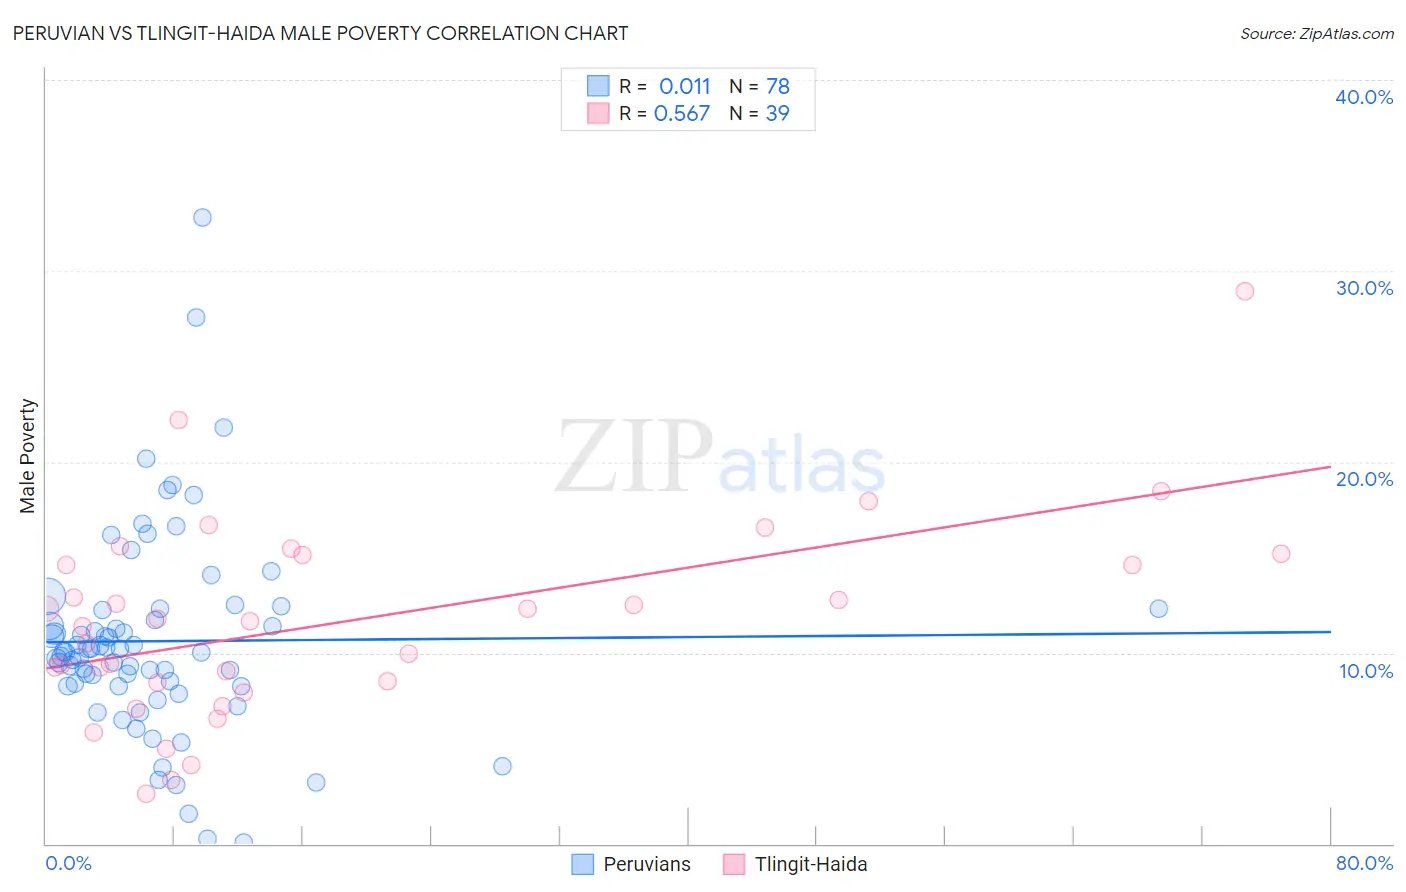
Peruvian vs Tlingit-Haida Male Poverty Correlation Chart
The statistical analysis conducted on geographies consisting of 362,866,213 people shows no correlation between the proportion of Peruvians and poverty level among males in the United States with a correlation coefficient (R) of 0.011 and weighted average of 10.7%. Similarly, the statistical analysis conducted on geographies consisting of 60,854,564 people shows a substantial positive correlation between the proportion of Tlingit-Haida and poverty level among males in the United States with a correlation coefficient (R) of 0.567 and weighted average of 10.9%, a difference of 1.9%.
Male Poverty Correlation Summary
| Measurement | Peruvian | Tlingit-Haida |
| Minimum | 0.066% | 2.6% |
| Maximum | 32.8% | 28.9% |
| Range | 32.7% | 26.3% |
| Mean | 10.6% | 11.7% |
| Median | 10.1% | 11.6% |
| Interquartile 25% (IQ1) | 8.3% | 8.5% |
| Interquartile 75% (IQ3) | 12.3% | 15.1% |
| Interquartile Range (IQR) | 4.0% | 6.6% |
| Standard Deviation (Sample) | 5.3% | 5.2% |
| Standard Deviation (Population) | 5.2% | 5.2% |
Demographics Similar to Peruvians and Tlingit-Haida by Male Poverty
In terms of male poverty, the demographic groups most similar to Peruvians are Immigrants from China (10.7%, a difference of 0.010%), Native Hawaiian (10.7%, a difference of 0.020%), South African (10.7%, a difference of 0.060%), French (10.7%, a difference of 0.080%), and Immigrants from Norway (10.7%, a difference of 0.23%). Similarly, the demographic groups most similar to Tlingit-Haida are Immigrants from Jordan (10.8%, a difference of 0.19%), Yugoslavian (10.8%, a difference of 0.31%), Immigrants from Switzerland (10.8%, a difference of 0.46%), Immigrants from Israel (10.8%, a difference of 0.73%), and Brazilian (10.8%, a difference of 1.0%).
| Demographics | Rating | Rank | Male Poverty |
| Immigrants | China | 87.1 /100 | #120 | Excellent 10.7% |
| Peruvians | 87.1 /100 | #121 | Excellent 10.7% |
| Native Hawaiians | 87.0 /100 | #122 | Excellent 10.7% |
| South Africans | 86.8 /100 | #123 | Excellent 10.7% |
| French | 86.7 /100 | #124 | Excellent 10.7% |
| Immigrants | Norway | 86.0 /100 | #125 | Excellent 10.7% |
| Immigrants | Ukraine | 84.3 /100 | #126 | Excellent 10.7% |
| Puget Sound Salish | 84.3 /100 | #127 | Excellent 10.7% |
| Immigrants | Western Europe | 84.2 /100 | #128 | Excellent 10.7% |
| Immigrants | Peru | 84.1 /100 | #129 | Excellent 10.7% |
| Chileans | 83.9 /100 | #130 | Excellent 10.7% |
| Immigrants | Belarus | 83.3 /100 | #131 | Excellent 10.7% |
| Immigrants | Vietnam | 83.0 /100 | #132 | Excellent 10.8% |
| Pakistanis | 83.0 /100 | #133 | Excellent 10.8% |
| New Zealanders | 82.9 /100 | #134 | Excellent 10.8% |
| Brazilians | 82.7 /100 | #135 | Excellent 10.8% |
| Immigrants | Israel | 80.9 /100 | #136 | Excellent 10.8% |
| Immigrants | Switzerland | 79.2 /100 | #137 | Good 10.8% |
| Yugoslavians | 78.2 /100 | #138 | Good 10.8% |
| Immigrants | Jordan | 77.5 /100 | #139 | Good 10.8% |
| Tlingit-Haida | 76.1 /100 | #140 | Good 10.9% |