Immigrants from Eastern Europe vs Tlingit-Haida Male Poverty
COMPARE
Immigrants from Eastern Europe
Tlingit-Haida
Male Poverty
Male Poverty Comparison
Immigrants from Eastern Europe
Tlingit-Haida
10.2%
MALE POVERTY
96.9/ 100
METRIC RATING
74th/ 347
METRIC RANK
10.9%
MALE POVERTY
76.1/ 100
METRIC RATING
140th/ 347
METRIC RANK
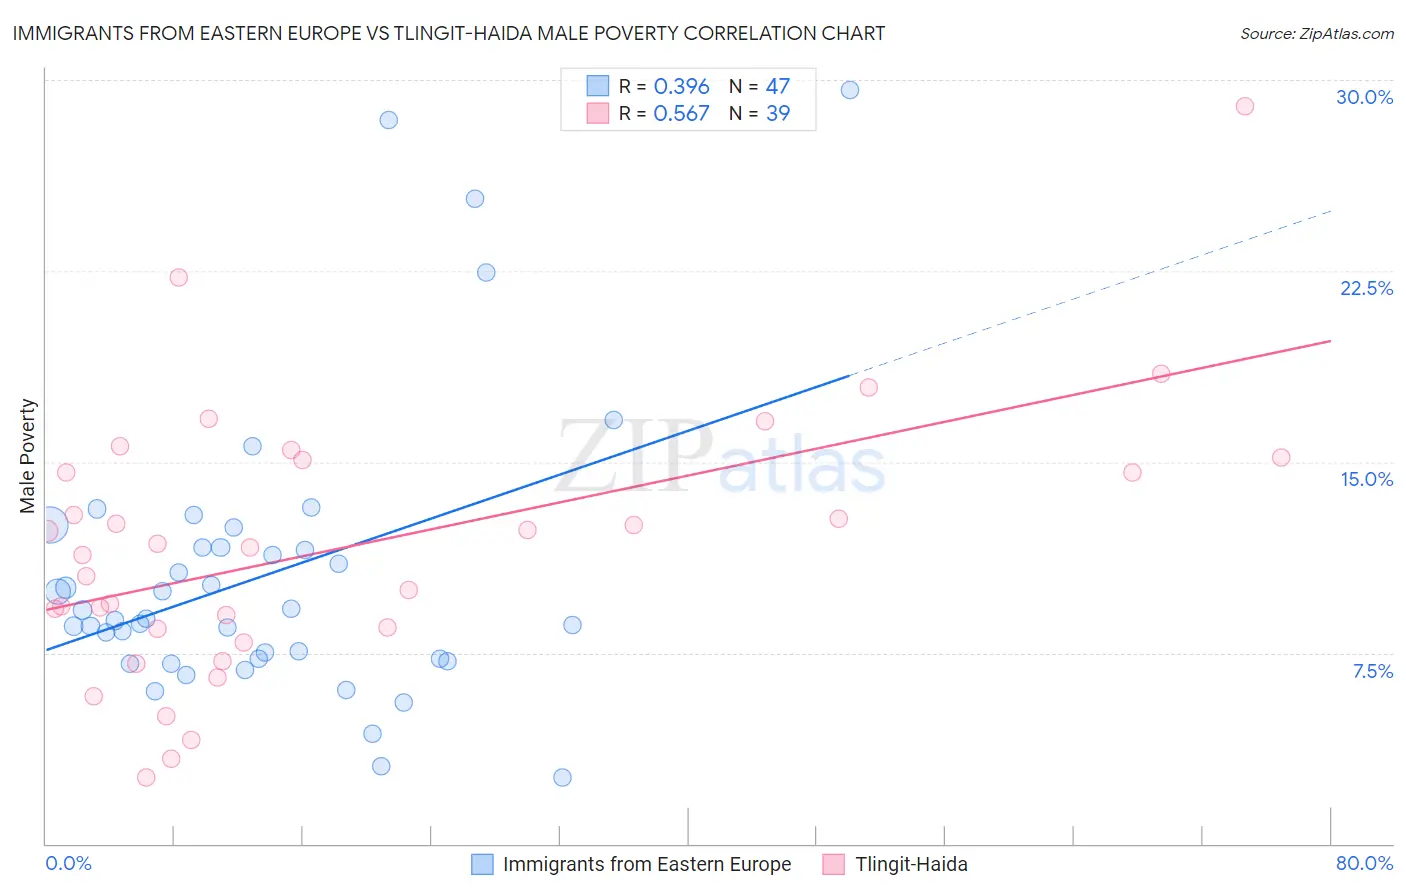
Immigrants from Eastern Europe vs Tlingit-Haida Male Poverty Correlation Chart
The statistical analysis conducted on geographies consisting of 475,131,955 people shows a mild positive correlation between the proportion of Immigrants from Eastern Europe and poverty level among males in the United States with a correlation coefficient (R) of 0.396 and weighted average of 10.2%. Similarly, the statistical analysis conducted on geographies consisting of 60,854,564 people shows a substantial positive correlation between the proportion of Tlingit-Haida and poverty level among males in the United States with a correlation coefficient (R) of 0.567 and weighted average of 10.9%, a difference of 6.1%.
Male Poverty Correlation Summary
| Measurement | Immigrants from Eastern Europe | Tlingit-Haida |
| Minimum | 2.6% | 2.6% |
| Maximum | 29.6% | 28.9% |
| Range | 27.0% | 26.3% |
| Mean | 10.6% | 11.7% |
| Median | 8.8% | 11.6% |
| Interquartile 25% (IQ1) | 7.3% | 8.5% |
| Interquartile 75% (IQ3) | 11.7% | 15.1% |
| Interquartile Range (IQR) | 4.4% | 6.6% |
| Standard Deviation (Sample) | 5.7% | 5.2% |
| Standard Deviation (Population) | 5.7% | 5.2% |
Similar Demographics by Male Poverty
Demographics Similar to Immigrants from Eastern Europe by Male Poverty
In terms of male poverty, the demographic groups most similar to Immigrants from Eastern Europe are Carpatho Rusyn (10.2%, a difference of 0.0%), Dutch (10.2%, a difference of 0.010%), Immigrants from Belgium (10.3%, a difference of 0.040%), Immigrants from Asia (10.2%, a difference of 0.070%), and Irish (10.3%, a difference of 0.070%).
| Demographics | Rating | Rank | Male Poverty |
| Immigrants | Netherlands | 97.3 /100 | #67 | Exceptional 10.2% |
| Immigrants | Sri Lanka | 97.2 /100 | #68 | Exceptional 10.2% |
| Immigrants | Australia | 97.1 /100 | #69 | Exceptional 10.2% |
| Paraguayans | 97.1 /100 | #70 | Exceptional 10.2% |
| Europeans | 97.1 /100 | #71 | Exceptional 10.2% |
| Immigrants | Canada | 97.1 /100 | #72 | Exceptional 10.2% |
| Immigrants | Asia | 97.0 /100 | #73 | Exceptional 10.2% |
| Immigrants | Eastern Europe | 96.9 /100 | #74 | Exceptional 10.2% |
| Carpatho Rusyns | 96.9 /100 | #75 | Exceptional 10.2% |
| Dutch | 96.9 /100 | #76 | Exceptional 10.2% |
| Immigrants | Belgium | 96.8 /100 | #77 | Exceptional 10.3% |
| Irish | 96.8 /100 | #78 | Exceptional 10.3% |
| Immigrants | North America | 96.5 /100 | #79 | Exceptional 10.3% |
| English | 96.4 /100 | #80 | Exceptional 10.3% |
| Belgians | 95.9 /100 | #81 | Exceptional 10.3% |
Demographics Similar to Tlingit-Haida by Male Poverty
In terms of male poverty, the demographic groups most similar to Tlingit-Haida are Immigrants from France (10.9%, a difference of 0.030%), Immigrants from Jordan (10.8%, a difference of 0.19%), Basque (10.9%, a difference of 0.20%), Yugoslavian (10.8%, a difference of 0.31%), and Immigrants from Switzerland (10.8%, a difference of 0.46%).
| Demographics | Rating | Rank | Male Poverty |
| Pakistanis | 83.0 /100 | #133 | Excellent 10.8% |
| New Zealanders | 82.9 /100 | #134 | Excellent 10.8% |
| Brazilians | 82.7 /100 | #135 | Excellent 10.8% |
| Immigrants | Israel | 80.9 /100 | #136 | Excellent 10.8% |
| Immigrants | Switzerland | 79.2 /100 | #137 | Good 10.8% |
| Yugoslavians | 78.2 /100 | #138 | Good 10.8% |
| Immigrants | Jordan | 77.5 /100 | #139 | Good 10.8% |
| Tlingit-Haida | 76.1 /100 | #140 | Good 10.9% |
| Immigrants | France | 75.8 /100 | #141 | Good 10.9% |
| Basques | 74.6 /100 | #142 | Good 10.9% |
| Afghans | 71.9 /100 | #143 | Good 10.9% |
| Samoans | 71.8 /100 | #144 | Good 10.9% |
| Immigrants | Germany | 71.6 /100 | #145 | Good 10.9% |
| Syrians | 71.4 /100 | #146 | Good 10.9% |
| Icelanders | 68.5 /100 | #147 | Good 11.0% |