Peruvian vs Immigrants from Trinidad and Tobago Male Poverty
COMPARE
Peruvian
Immigrants from Trinidad and Tobago
Male Poverty
Male Poverty Comparison
Peruvians
Immigrants from Trinidad and Tobago
10.7%
MALE POVERTY
87.1/ 100
METRIC RATING
121st/ 347
METRIC RANK
13.1%
MALE POVERTY
0.1/ 100
METRIC RATING
257th/ 347
METRIC RANK
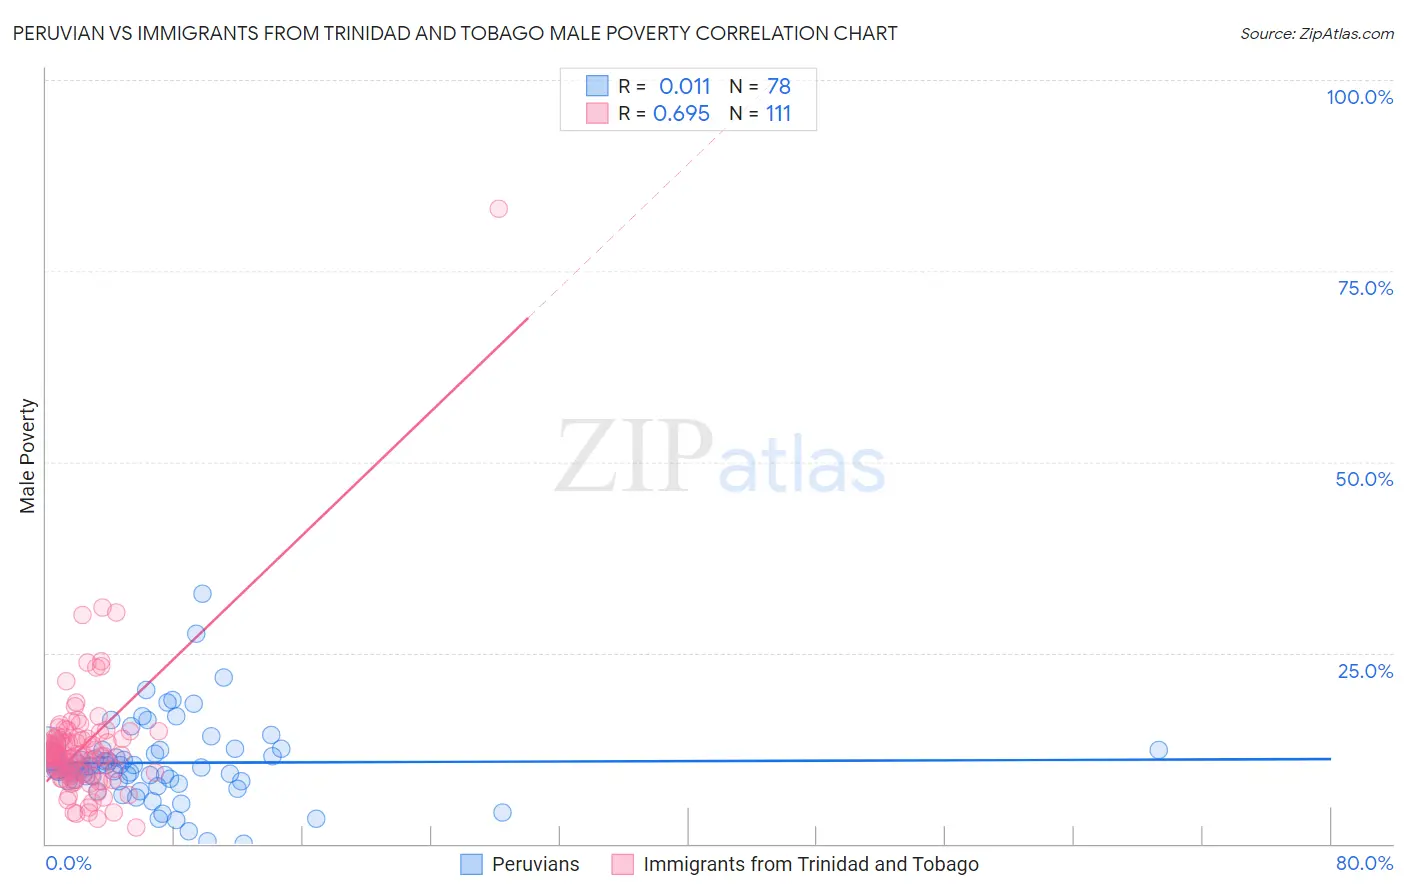
Peruvian vs Immigrants from Trinidad and Tobago Male Poverty Correlation Chart
The statistical analysis conducted on geographies consisting of 362,866,213 people shows no correlation between the proportion of Peruvians and poverty level among males in the United States with a correlation coefficient (R) of 0.011 and weighted average of 10.7%. Similarly, the statistical analysis conducted on geographies consisting of 223,466,412 people shows a significant positive correlation between the proportion of Immigrants from Trinidad and Tobago and poverty level among males in the United States with a correlation coefficient (R) of 0.695 and weighted average of 13.1%, a difference of 22.4%.
Male Poverty Correlation Summary
| Measurement | Peruvian | Immigrants from Trinidad and Tobago |
| Minimum | 0.066% | 2.1% |
| Maximum | 32.8% | 83.2% |
| Range | 32.7% | 81.1% |
| Mean | 10.6% | 12.7% |
| Median | 10.1% | 11.6% |
| Interquartile 25% (IQ1) | 8.3% | 9.3% |
| Interquartile 75% (IQ3) | 12.3% | 13.7% |
| Interquartile Range (IQR) | 4.0% | 4.4% |
| Standard Deviation (Sample) | 5.3% | 8.4% |
| Standard Deviation (Population) | 5.2% | 8.4% |
Similar Demographics by Male Poverty
Demographics Similar to Peruvians by Male Poverty
In terms of male poverty, the demographic groups most similar to Peruvians are Immigrants from China (10.7%, a difference of 0.010%), Native Hawaiian (10.7%, a difference of 0.020%), South African (10.7%, a difference of 0.060%), French (10.7%, a difference of 0.080%), and Immigrants from Hungary (10.7%, a difference of 0.11%).
| Demographics | Rating | Rank | Male Poverty |
| Immigrants | Brazil | 89.0 /100 | #114 | Excellent 10.6% |
| Immigrants | Russia | 88.6 /100 | #115 | Excellent 10.6% |
| Sri Lankans | 88.1 /100 | #116 | Excellent 10.6% |
| Immigrants | South Eastern Asia | 88.1 /100 | #117 | Excellent 10.6% |
| Okinawans | 87.6 /100 | #118 | Excellent 10.7% |
| Immigrants | Hungary | 87.6 /100 | #119 | Excellent 10.7% |
| Immigrants | China | 87.1 /100 | #120 | Excellent 10.7% |
| Peruvians | 87.1 /100 | #121 | Excellent 10.7% |
| Native Hawaiians | 87.0 /100 | #122 | Excellent 10.7% |
| South Africans | 86.8 /100 | #123 | Excellent 10.7% |
| French | 86.7 /100 | #124 | Excellent 10.7% |
| Immigrants | Norway | 86.0 /100 | #125 | Excellent 10.7% |
| Immigrants | Ukraine | 84.3 /100 | #126 | Excellent 10.7% |
| Puget Sound Salish | 84.3 /100 | #127 | Excellent 10.7% |
| Immigrants | Western Europe | 84.2 /100 | #128 | Excellent 10.7% |
Demographics Similar to Immigrants from Trinidad and Tobago by Male Poverty
In terms of male poverty, the demographic groups most similar to Immigrants from Trinidad and Tobago are Cape Verdean (13.1%, a difference of 0.13%), Immigrants from Burma/Myanmar (13.0%, a difference of 0.26%), Cherokee (13.1%, a difference of 0.29%), Ottawa (13.1%, a difference of 0.40%), and Trinidadian and Tobagonian (13.1%, a difference of 0.42%).
| Demographics | Rating | Rank | Male Poverty |
| Immigrants | Nicaragua | 0.2 /100 | #250 | Tragic 12.9% |
| Immigrants | Cuba | 0.2 /100 | #251 | Tragic 12.9% |
| Immigrants | Ecuador | 0.2 /100 | #252 | Tragic 12.9% |
| Immigrants | Ghana | 0.2 /100 | #253 | Tragic 12.9% |
| Mexican American Indians | 0.1 /100 | #254 | Tragic 13.0% |
| Immigrants | Liberia | 0.1 /100 | #255 | Tragic 13.0% |
| Immigrants | Burma/Myanmar | 0.1 /100 | #256 | Tragic 13.0% |
| Immigrants | Trinidad and Tobago | 0.1 /100 | #257 | Tragic 13.1% |
| Cape Verdeans | 0.1 /100 | #258 | Tragic 13.1% |
| Cherokee | 0.1 /100 | #259 | Tragic 13.1% |
| Ottawa | 0.1 /100 | #260 | Tragic 13.1% |
| Trinidadians and Tobagonians | 0.1 /100 | #261 | Tragic 13.1% |
| Spanish American Indians | 0.1 /100 | #262 | Tragic 13.1% |
| Central Americans | 0.1 /100 | #263 | Tragic 13.2% |
| Iroquois | 0.1 /100 | #264 | Tragic 13.2% |