Macedonian vs Latvian Single Male Poverty
COMPARE
Macedonian
Latvian
Single Male Poverty
Single Male Poverty Comparison
Macedonians
Latvians
12.9%
SINGLE MALE POVERTY
31.5/ 100
METRIC RATING
188th/ 347
METRIC RANK
12.7%
SINGLE MALE POVERTY
67.9/ 100
METRIC RATING
157th/ 347
METRIC RANK
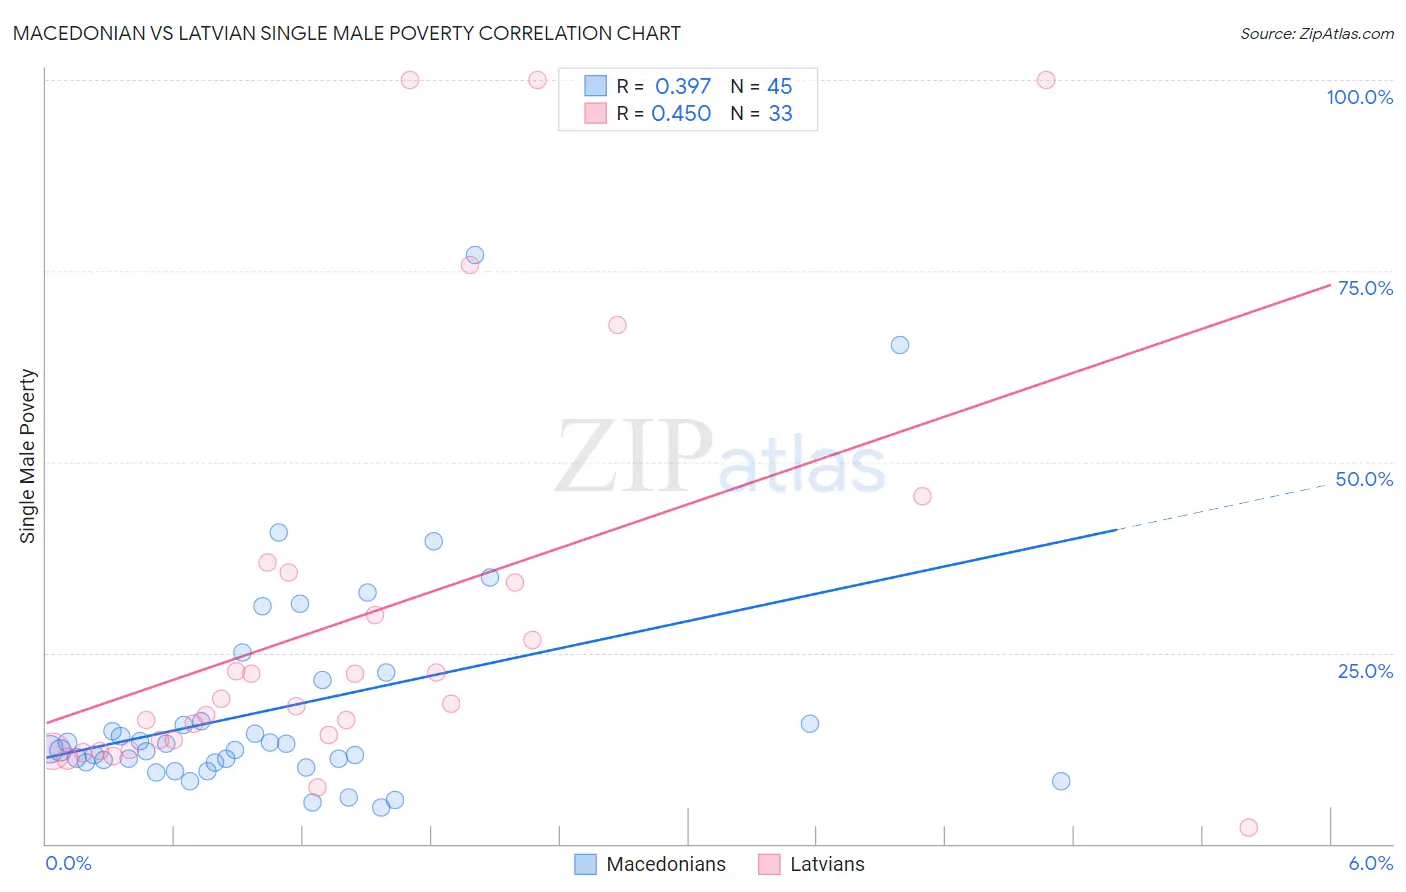
Macedonian vs Latvian Single Male Poverty Correlation Chart
The statistical analysis conducted on geographies consisting of 122,668,243 people shows a mild positive correlation between the proportion of Macedonians and poverty level among single males in the United States with a correlation coefficient (R) of 0.397 and weighted average of 12.9%. Similarly, the statistical analysis conducted on geographies consisting of 199,264,855 people shows a moderate positive correlation between the proportion of Latvians and poverty level among single males in the United States with a correlation coefficient (R) of 0.450 and weighted average of 12.7%, a difference of 2.0%.
Single Male Poverty Correlation Summary
| Measurement | Macedonian | Latvian |
| Minimum | 4.8% | 2.2% |
| Maximum | 77.1% | 100.0% |
| Range | 72.3% | 97.8% |
| Mean | 17.9% | 29.8% |
| Median | 12.4% | 18.3% |
| Interquartile 25% (IQ1) | 10.7% | 13.0% |
| Interquartile 75% (IQ3) | 18.7% | 34.9% |
| Interquartile Range (IQR) | 8.1% | 21.9% |
| Standard Deviation (Sample) | 14.7% | 27.4% |
| Standard Deviation (Population) | 14.5% | 27.0% |
Similar Demographics by Single Male Poverty
Demographics Similar to Macedonians by Single Male Poverty
In terms of single male poverty, the demographic groups most similar to Macedonians are Immigrants from Kuwait (12.9%, a difference of 0.020%), Norwegian (12.9%, a difference of 0.030%), Nigerian (12.9%, a difference of 0.030%), Immigrants from Trinidad and Tobago (12.9%, a difference of 0.060%), and Portuguese (12.9%, a difference of 0.080%).
| Demographics | Rating | Rank | Single Male Poverty |
| Panamanians | 37.6 /100 | #181 | Fair 12.9% |
| Moroccans | 36.8 /100 | #182 | Fair 12.9% |
| Immigrants | West Indies | 33.0 /100 | #183 | Fair 12.9% |
| Immigrants | Trinidad and Tobago | 32.5 /100 | #184 | Fair 12.9% |
| Norwegians | 32.0 /100 | #185 | Fair 12.9% |
| Nigerians | 31.9 /100 | #186 | Fair 12.9% |
| Immigrants | Kuwait | 31.9 /100 | #187 | Fair 12.9% |
| Macedonians | 31.5 /100 | #188 | Fair 12.9% |
| Portuguese | 30.2 /100 | #189 | Fair 12.9% |
| Arabs | 27.0 /100 | #190 | Fair 13.0% |
| Immigrants | Thailand | 26.6 /100 | #191 | Fair 13.0% |
| Immigrants | Jamaica | 26.5 /100 | #192 | Fair 13.0% |
| Immigrants | South Africa | 26.1 /100 | #193 | Fair 13.0% |
| Liberians | 25.2 /100 | #194 | Fair 13.0% |
| Immigrants | England | 23.4 /100 | #195 | Fair 13.0% |
Demographics Similar to Latvians by Single Male Poverty
In terms of single male poverty, the demographic groups most similar to Latvians are Vietnamese (12.7%, a difference of 0.0%), Immigrants from Spain (12.7%, a difference of 0.040%), Immigrants from Scotland (12.7%, a difference of 0.060%), Immigrants (12.7%, a difference of 0.13%), and Immigrants from Middle Africa (12.7%, a difference of 0.18%).
| Demographics | Rating | Rank | Single Male Poverty |
| Immigrants | Panama | 72.1 /100 | #150 | Good 12.6% |
| Immigrants | Hungary | 71.9 /100 | #151 | Good 12.6% |
| Australians | 71.4 /100 | #152 | Good 12.6% |
| Immigrants | Immigrants | 70.1 /100 | #153 | Good 12.7% |
| Immigrants | Scotland | 68.9 /100 | #154 | Good 12.7% |
| Immigrants | Spain | 68.7 /100 | #155 | Good 12.7% |
| Vietnamese | 67.9 /100 | #156 | Good 12.7% |
| Latvians | 67.9 /100 | #157 | Good 12.7% |
| Immigrants | Middle Africa | 64.9 /100 | #158 | Good 12.7% |
| Immigrants | Liberia | 64.2 /100 | #159 | Good 12.7% |
| Greeks | 64.1 /100 | #160 | Good 12.7% |
| Immigrants | Africa | 63.4 /100 | #161 | Good 12.7% |
| Eastern Europeans | 63.3 /100 | #162 | Good 12.7% |
| Palestinians | 63.1 /100 | #163 | Good 12.7% |
| Immigrants | Nigeria | 62.8 /100 | #164 | Good 12.7% |