Paraguayan vs Immigrants from Burma/Myanmar Seniors Poverty Over the Age of 65
COMPARE
Paraguayan
Immigrants from Burma/Myanmar
Seniors Poverty Over the Age of 65
Seniors Poverty Over the Age of 65 Comparison
Paraguayans
Immigrants from Burma/Myanmar
11.4%
SENIORS POVERTY OVER THE AGE OF 65
11.3/ 100
METRIC RATING
209th/ 347
METRIC RANK
11.3%
SENIORS POVERTY OVER THE AGE OF 65
21.3/ 100
METRIC RATING
198th/ 347
METRIC RANK
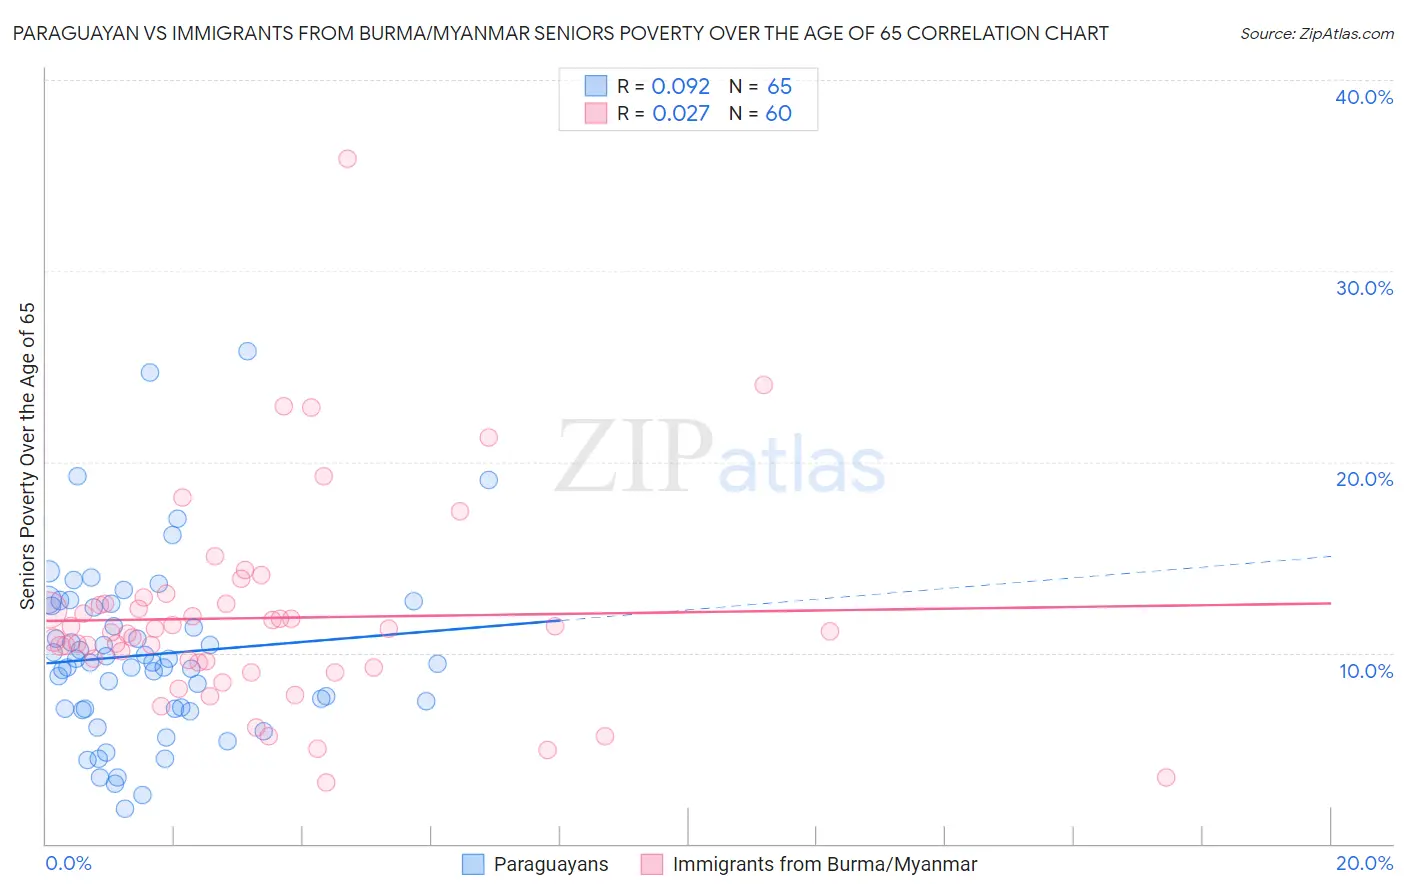
Paraguayan vs Immigrants from Burma/Myanmar Seniors Poverty Over the Age of 65 Correlation Chart
The statistical analysis conducted on geographies consisting of 95,049,863 people shows a slight positive correlation between the proportion of Paraguayans and poverty level among seniors over the age of 65 in the United States with a correlation coefficient (R) of 0.092 and weighted average of 11.4%. Similarly, the statistical analysis conducted on geographies consisting of 172,103,191 people shows no correlation between the proportion of Immigrants from Burma/Myanmar and poverty level among seniors over the age of 65 in the United States with a correlation coefficient (R) of 0.027 and weighted average of 11.3%, a difference of 1.6%.
Seniors Poverty Over the Age of 65 Correlation Summary
| Measurement | Paraguayan | Immigrants from Burma/Myanmar |
| Minimum | 1.8% | 3.2% |
| Maximum | 25.8% | 35.9% |
| Range | 24.0% | 32.6% |
| Mean | 9.9% | 11.8% |
| Median | 9.5% | 11.1% |
| Interquartile 25% (IQ1) | 7.1% | 9.4% |
| Interquartile 75% (IQ3) | 12.5% | 12.6% |
| Interquartile Range (IQR) | 5.5% | 3.2% |
| Standard Deviation (Sample) | 4.6% | 5.4% |
| Standard Deviation (Population) | 4.6% | 5.3% |
Demographics Similar to Paraguayans and Immigrants from Burma/Myanmar by Seniors Poverty Over the Age of 65
In terms of seniors poverty over the age of 65, the demographic groups most similar to Paraguayans are Ugandan (11.4%, a difference of 0.020%), South American Indian (11.4%, a difference of 0.070%), Indonesian (11.5%, a difference of 0.21%), Immigrants from China (11.5%, a difference of 0.41%), and Immigrants from Western Asia (11.4%, a difference of 0.44%). Similarly, the demographic groups most similar to Immigrants from Burma/Myanmar are Immigrants from Israel (11.3%, a difference of 0.13%), Alsatian (11.3%, a difference of 0.16%), Albanian (11.2%, a difference of 0.38%), Bangladeshi (11.2%, a difference of 0.47%), and Immigrants from Brazil (11.3%, a difference of 0.48%).
| Demographics | Rating | Rank | Seniors Poverty Over the Age of 65 |
| Taiwanese | 29.2 /100 | #193 | Fair 11.2% |
| Chileans | 27.8 /100 | #194 | Fair 11.2% |
| Immigrants | Vietnam | 26.6 /100 | #195 | Fair 11.2% |
| Bangladeshis | 25.2 /100 | #196 | Fair 11.2% |
| Albanians | 24.4 /100 | #197 | Fair 11.2% |
| Immigrants | Burma/Myanmar | 21.3 /100 | #198 | Fair 11.3% |
| Immigrants | Israel | 20.3 /100 | #199 | Fair 11.3% |
| Alsatians | 20.1 /100 | #200 | Fair 11.3% |
| Immigrants | Brazil | 17.8 /100 | #201 | Poor 11.3% |
| Costa Ricans | 17.0 /100 | #202 | Poor 11.3% |
| Immigrants | Zaire | 16.9 /100 | #203 | Poor 11.3% |
| Israelis | 16.5 /100 | #204 | Poor 11.3% |
| Brazilians | 15.4 /100 | #205 | Poor 11.3% |
| Choctaw | 14.5 /100 | #206 | Poor 11.4% |
| Immigrants | Western Asia | 13.6 /100 | #207 | Poor 11.4% |
| South American Indians | 11.7 /100 | #208 | Poor 11.4% |
| Paraguayans | 11.3 /100 | #209 | Poor 11.4% |
| Ugandans | 11.2 /100 | #210 | Poor 11.4% |
| Indonesians | 10.4 /100 | #211 | Poor 11.5% |
| Immigrants | China | 9.5 /100 | #212 | Tragic 11.5% |
| Nepalese | 8.9 /100 | #213 | Tragic 11.5% |