Paraguayan vs Arab Seniors Poverty Over the Age of 65
COMPARE
Paraguayan
Arab
Seniors Poverty Over the Age of 65
Seniors Poverty Over the Age of 65 Comparison
Paraguayans
Arabs
11.4%
SENIORS POVERTY OVER THE AGE OF 65
11.3/ 100
METRIC RATING
209th/ 347
METRIC RANK
10.8%
SENIORS POVERTY OVER THE AGE OF 65
65.2/ 100
METRIC RATING
161st/ 347
METRIC RANK
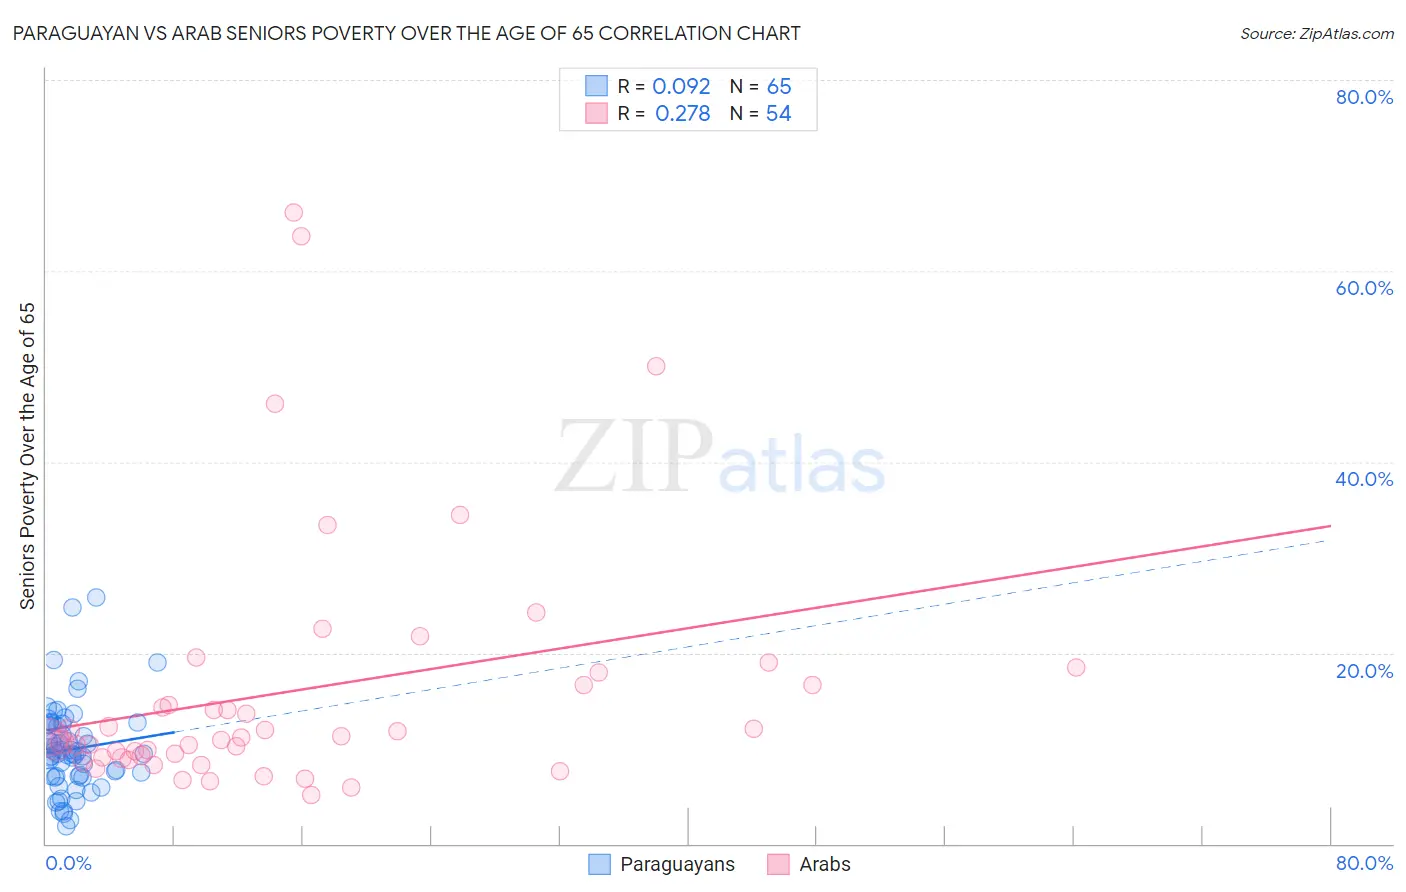
Paraguayan vs Arab Seniors Poverty Over the Age of 65 Correlation Chart
The statistical analysis conducted on geographies consisting of 95,049,863 people shows a slight positive correlation between the proportion of Paraguayans and poverty level among seniors over the age of 65 in the United States with a correlation coefficient (R) of 0.092 and weighted average of 11.4%. Similarly, the statistical analysis conducted on geographies consisting of 484,434,230 people shows a weak positive correlation between the proportion of Arabs and poverty level among seniors over the age of 65 in the United States with a correlation coefficient (R) of 0.278 and weighted average of 10.8%, a difference of 6.0%.
Seniors Poverty Over the Age of 65 Correlation Summary
| Measurement | Paraguayan | Arab |
| Minimum | 1.8% | 5.0% |
| Maximum | 25.8% | 66.1% |
| Range | 24.0% | 61.1% |
| Mean | 9.9% | 15.9% |
| Median | 9.5% | 11.1% |
| Interquartile 25% (IQ1) | 7.1% | 9.1% |
| Interquartile 75% (IQ3) | 12.5% | 16.7% |
| Interquartile Range (IQR) | 5.5% | 7.6% |
| Standard Deviation (Sample) | 4.6% | 13.2% |
| Standard Deviation (Population) | 4.6% | 13.1% |
Similar Demographics by Seniors Poverty Over the Age of 65
Demographics Similar to Paraguayans by Seniors Poverty Over the Age of 65
In terms of seniors poverty over the age of 65, the demographic groups most similar to Paraguayans are Ugandan (11.4%, a difference of 0.020%), South American Indian (11.4%, a difference of 0.070%), Indonesian (11.5%, a difference of 0.21%), Immigrants from China (11.5%, a difference of 0.41%), and Immigrants from Western Asia (11.4%, a difference of 0.44%).
| Demographics | Rating | Rank | Seniors Poverty Over the Age of 65 |
| Costa Ricans | 17.0 /100 | #202 | Poor 11.3% |
| Immigrants | Zaire | 16.9 /100 | #203 | Poor 11.3% |
| Israelis | 16.5 /100 | #204 | Poor 11.3% |
| Brazilians | 15.4 /100 | #205 | Poor 11.3% |
| Choctaw | 14.5 /100 | #206 | Poor 11.4% |
| Immigrants | Western Asia | 13.6 /100 | #207 | Poor 11.4% |
| South American Indians | 11.7 /100 | #208 | Poor 11.4% |
| Paraguayans | 11.3 /100 | #209 | Poor 11.4% |
| Ugandans | 11.2 /100 | #210 | Poor 11.4% |
| Indonesians | 10.4 /100 | #211 | Poor 11.5% |
| Immigrants | China | 9.5 /100 | #212 | Tragic 11.5% |
| Nepalese | 8.9 /100 | #213 | Tragic 11.5% |
| Immigrants | Russia | 8.8 /100 | #214 | Tragic 11.5% |
| French American Indians | 8.7 /100 | #215 | Tragic 11.5% |
| Immigrants | Morocco | 6.8 /100 | #216 | Tragic 11.6% |
Demographics Similar to Arabs by Seniors Poverty Over the Age of 65
In terms of seniors poverty over the age of 65, the demographic groups most similar to Arabs are Immigrants from Indonesia (10.8%, a difference of 0.040%), Tsimshian (10.8%, a difference of 0.070%), Potawatomi (10.8%, a difference of 0.26%), Sudanese (10.7%, a difference of 0.31%), and Immigrants from South Eastern Asia (10.8%, a difference of 0.31%).
| Demographics | Rating | Rank | Seniors Poverty Over the Age of 65 |
| Immigrants | Saudi Arabia | 74.9 /100 | #154 | Good 10.7% |
| Chickasaw | 73.6 /100 | #155 | Good 10.7% |
| Ethiopians | 72.9 /100 | #156 | Good 10.7% |
| Immigrants | Ethiopia | 72.9 /100 | #157 | Good 10.7% |
| Immigrants | Sierra Leone | 71.7 /100 | #158 | Good 10.7% |
| Immigrants | Micronesia | 70.8 /100 | #159 | Good 10.7% |
| Sudanese | 68.2 /100 | #160 | Good 10.7% |
| Arabs | 65.2 /100 | #161 | Good 10.8% |
| Immigrants | Indonesia | 64.8 /100 | #162 | Good 10.8% |
| Tsimshian | 64.5 /100 | #163 | Good 10.8% |
| Potawatomi | 62.6 /100 | #164 | Good 10.8% |
| Immigrants | South Eastern Asia | 62.1 /100 | #165 | Good 10.8% |
| Malaysians | 62.0 /100 | #166 | Good 10.8% |
| Alaska Natives | 60.3 /100 | #167 | Good 10.8% |
| Mongolians | 58.0 /100 | #168 | Average 10.9% |