Black/African American vs Immigrants from Burma/Myanmar Seniors Poverty Over the Age of 65
COMPARE
Black/African American
Immigrants from Burma/Myanmar
Seniors Poverty Over the Age of 65
Seniors Poverty Over the Age of 65 Comparison
Blacks/African Americans
Immigrants from Burma/Myanmar
13.7%
SENIORS POVERTY OVER THE AGE OF 65
0.0/ 100
METRIC RATING
291st/ 347
METRIC RANK
11.3%
SENIORS POVERTY OVER THE AGE OF 65
21.3/ 100
METRIC RATING
198th/ 347
METRIC RANK
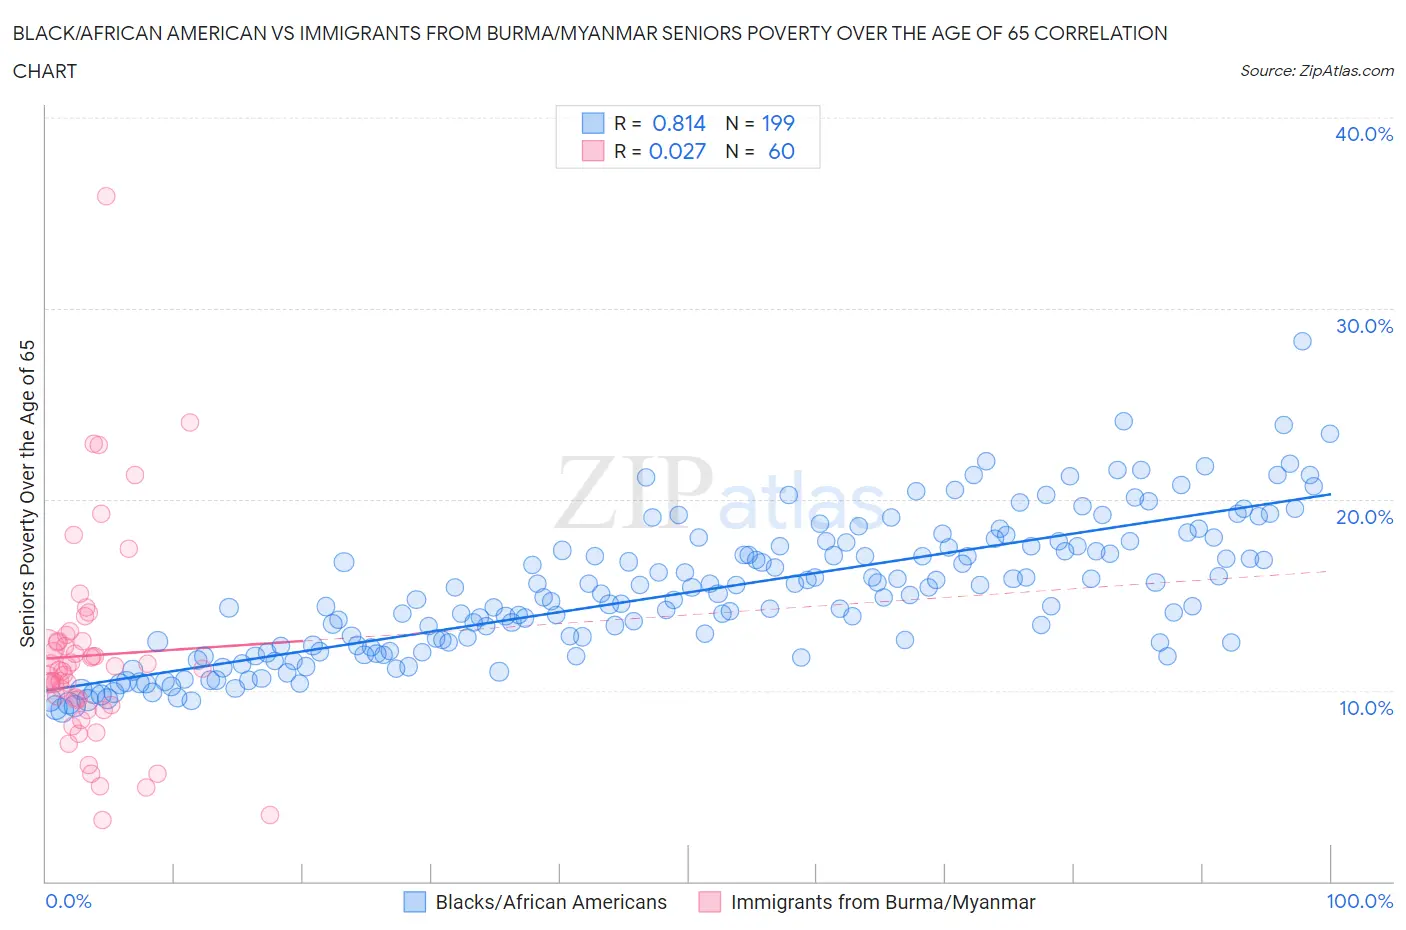
Black/African American vs Immigrants from Burma/Myanmar Seniors Poverty Over the Age of 65 Correlation Chart
The statistical analysis conducted on geographies consisting of 561,317,692 people shows a very strong positive correlation between the proportion of Blacks/African Americans and poverty level among seniors over the age of 65 in the United States with a correlation coefficient (R) of 0.814 and weighted average of 13.7%. Similarly, the statistical analysis conducted on geographies consisting of 172,103,191 people shows no correlation between the proportion of Immigrants from Burma/Myanmar and poverty level among seniors over the age of 65 in the United States with a correlation coefficient (R) of 0.027 and weighted average of 11.3%, a difference of 21.8%.
Seniors Poverty Over the Age of 65 Correlation Summary
| Measurement | Black/African American | Immigrants from Burma/Myanmar |
| Minimum | 9.0% | 3.2% |
| Maximum | 28.3% | 35.9% |
| Range | 19.3% | 32.6% |
| Mean | 15.1% | 11.8% |
| Median | 14.8% | 11.1% |
| Interquartile 25% (IQ1) | 12.0% | 9.4% |
| Interquartile 75% (IQ3) | 17.5% | 12.6% |
| Interquartile Range (IQR) | 5.5% | 3.2% |
| Standard Deviation (Sample) | 3.6% | 5.4% |
| Standard Deviation (Population) | 3.6% | 5.3% |
Similar Demographics by Seniors Poverty Over the Age of 65
Demographics Similar to Blacks/African Americans by Seniors Poverty Over the Age of 65
In terms of seniors poverty over the age of 65, the demographic groups most similar to Blacks/African Americans are Jamaican (13.6%, a difference of 0.46%), Immigrants from Central America (13.6%, a difference of 0.46%), Spanish American Indian (13.8%, a difference of 0.69%), Belizean (13.6%, a difference of 0.73%), and Immigrants from Mexico (13.6%, a difference of 0.87%).
| Demographics | Rating | Rank | Seniors Poverty Over the Age of 65 |
| Colville | 0.0 /100 | #284 | Tragic 13.5% |
| Guatemalans | 0.0 /100 | #285 | Tragic 13.5% |
| Immigrants | Senegal | 0.0 /100 | #286 | Tragic 13.6% |
| Immigrants | Mexico | 0.0 /100 | #287 | Tragic 13.6% |
| Belizeans | 0.0 /100 | #288 | Tragic 13.6% |
| Jamaicans | 0.0 /100 | #289 | Tragic 13.6% |
| Immigrants | Central America | 0.0 /100 | #290 | Tragic 13.6% |
| Blacks/African Americans | 0.0 /100 | #291 | Tragic 13.7% |
| Spanish American Indians | 0.0 /100 | #292 | Tragic 13.8% |
| Immigrants | Guatemala | 0.0 /100 | #293 | Tragic 13.8% |
| Cheyenne | 0.0 /100 | #294 | Tragic 13.9% |
| Apache | 0.0 /100 | #295 | Tragic 13.9% |
| Immigrants | Jamaica | 0.0 /100 | #296 | Tragic 13.9% |
| Vietnamese | 0.0 /100 | #297 | Tragic 14.0% |
| Immigrants | Belize | 0.0 /100 | #298 | Tragic 14.0% |
Demographics Similar to Immigrants from Burma/Myanmar by Seniors Poverty Over the Age of 65
In terms of seniors poverty over the age of 65, the demographic groups most similar to Immigrants from Burma/Myanmar are Immigrants from Israel (11.3%, a difference of 0.13%), Alsatian (11.3%, a difference of 0.16%), Albanian (11.2%, a difference of 0.38%), Bangladeshi (11.2%, a difference of 0.47%), and Immigrants from Brazil (11.3%, a difference of 0.48%).
| Demographics | Rating | Rank | Seniors Poverty Over the Age of 65 |
| Immigrants | Uganda | 32.2 /100 | #191 | Fair 11.1% |
| Immigrants | Southern Europe | 30.1 /100 | #192 | Fair 11.1% |
| Taiwanese | 29.2 /100 | #193 | Fair 11.2% |
| Chileans | 27.8 /100 | #194 | Fair 11.2% |
| Immigrants | Vietnam | 26.6 /100 | #195 | Fair 11.2% |
| Bangladeshis | 25.2 /100 | #196 | Fair 11.2% |
| Albanians | 24.4 /100 | #197 | Fair 11.2% |
| Immigrants | Burma/Myanmar | 21.3 /100 | #198 | Fair 11.3% |
| Immigrants | Israel | 20.3 /100 | #199 | Fair 11.3% |
| Alsatians | 20.1 /100 | #200 | Fair 11.3% |
| Immigrants | Brazil | 17.8 /100 | #201 | Poor 11.3% |
| Costa Ricans | 17.0 /100 | #202 | Poor 11.3% |
| Immigrants | Zaire | 16.9 /100 | #203 | Poor 11.3% |
| Israelis | 16.5 /100 | #204 | Poor 11.3% |
| Brazilians | 15.4 /100 | #205 | Poor 11.3% |