Panamanian vs Pima Single Male Poverty
COMPARE
Panamanian
Pima
Single Male Poverty
Single Male Poverty Comparison
Panamanians
Pima
12.9%
SINGLE MALE POVERTY
37.6/ 100
METRIC RATING
181st/ 347
METRIC RANK
20.2%
SINGLE MALE POVERTY
0.0/ 100
METRIC RATING
334th/ 347
METRIC RANK
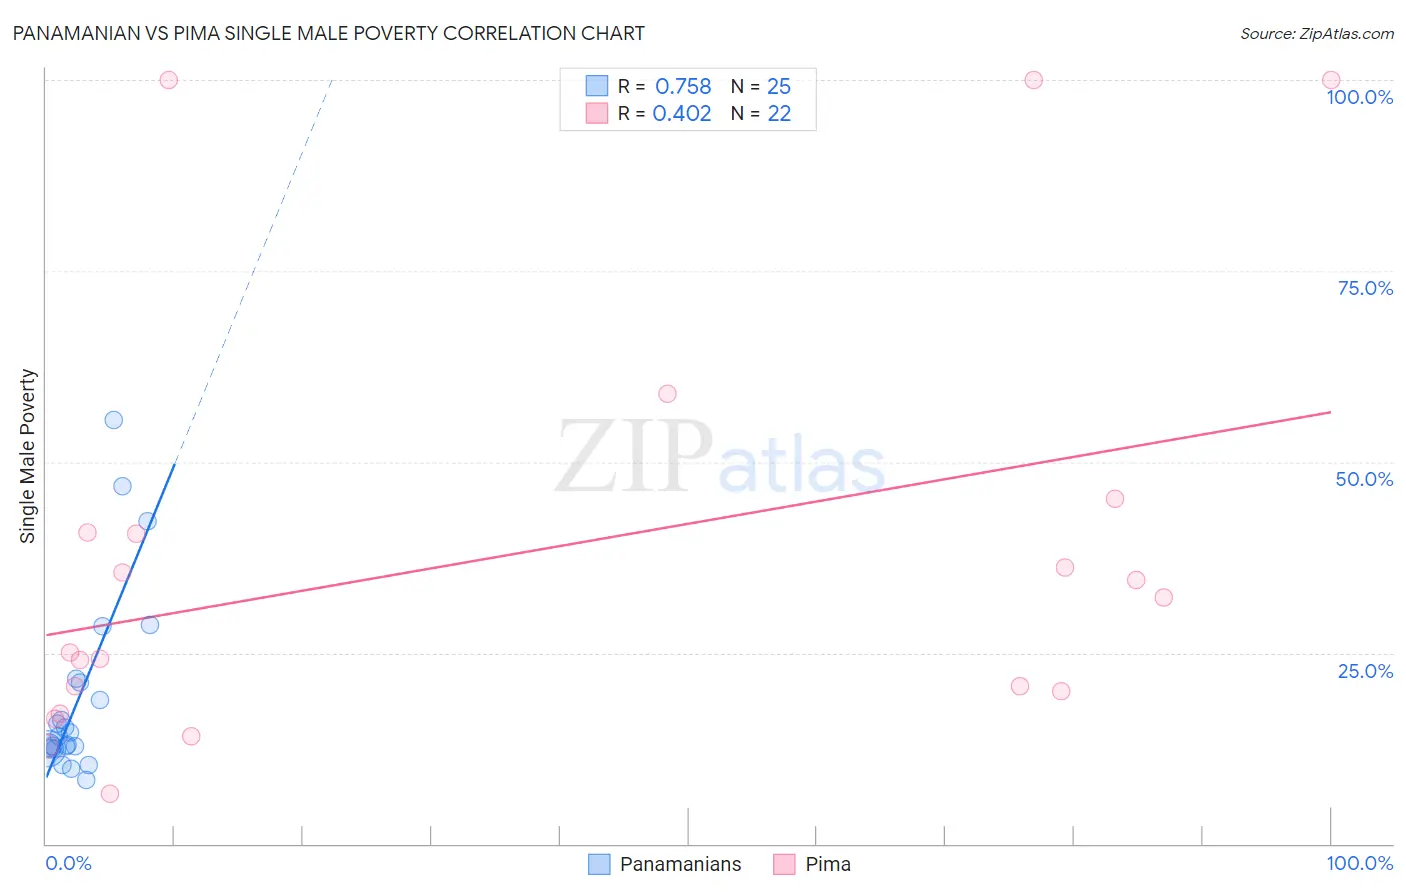
Panamanian vs Pima Single Male Poverty Correlation Chart
The statistical analysis conducted on geographies consisting of 259,773,019 people shows a strong positive correlation between the proportion of Panamanians and poverty level among single males in the United States with a correlation coefficient (R) of 0.758 and weighted average of 12.9%. Similarly, the statistical analysis conducted on geographies consisting of 60,152,261 people shows a moderate positive correlation between the proportion of Pima and poverty level among single males in the United States with a correlation coefficient (R) of 0.402 and weighted average of 20.2%, a difference of 56.4%.
Single Male Poverty Correlation Summary
| Measurement | Panamanian | Pima |
| Minimum | 8.3% | 6.5% |
| Maximum | 55.6% | 100.0% |
| Range | 47.2% | 93.5% |
| Mean | 19.2% | 37.5% |
| Median | 14.1% | 28.6% |
| Interquartile 25% (IQ1) | 12.4% | 20.0% |
| Interquartile 75% (IQ3) | 21.4% | 40.7% |
| Interquartile Range (IQR) | 8.9% | 20.7% |
| Standard Deviation (Sample) | 12.2% | 28.2% |
| Standard Deviation (Population) | 12.0% | 27.5% |
Similar Demographics by Single Male Poverty
Demographics Similar to Panamanians by Single Male Poverty
In terms of single male poverty, the demographic groups most similar to Panamanians are Immigrants from North America (12.9%, a difference of 0.010%), Moroccan (12.9%, a difference of 0.040%), Israeli (12.9%, a difference of 0.19%), Immigrants from West Indies (12.9%, a difference of 0.26%), and Immigrants from Trinidad and Tobago (12.9%, a difference of 0.29%).
| Demographics | Rating | Rank | Single Male Poverty |
| Costa Ricans | 50.0 /100 | #174 | Average 12.8% |
| Croatians | 48.9 /100 | #175 | Average 12.8% |
| Syrians | 48.4 /100 | #176 | Average 12.8% |
| Immigrants | Canada | 44.8 /100 | #177 | Average 12.8% |
| Immigrants | Switzerland | 43.1 /100 | #178 | Average 12.8% |
| Israelis | 41.0 /100 | #179 | Average 12.9% |
| Immigrants | North America | 37.7 /100 | #180 | Fair 12.9% |
| Panamanians | 37.6 /100 | #181 | Fair 12.9% |
| Moroccans | 36.8 /100 | #182 | Fair 12.9% |
| Immigrants | West Indies | 33.0 /100 | #183 | Fair 12.9% |
| Immigrants | Trinidad and Tobago | 32.5 /100 | #184 | Fair 12.9% |
| Norwegians | 32.0 /100 | #185 | Fair 12.9% |
| Nigerians | 31.9 /100 | #186 | Fair 12.9% |
| Immigrants | Kuwait | 31.9 /100 | #187 | Fair 12.9% |
| Macedonians | 31.5 /100 | #188 | Fair 12.9% |
Demographics Similar to Pima by Single Male Poverty
In terms of single male poverty, the demographic groups most similar to Pima are Inupiat (20.0%, a difference of 0.80%), Native/Alaskan (19.6%, a difference of 2.7%), Paiute (19.3%, a difference of 4.4%), Cajun (19.1%, a difference of 5.7%), and Yuman (21.3%, a difference of 5.7%).
| Demographics | Rating | Rank | Single Male Poverty |
| Menominee | 0.0 /100 | #327 | Tragic 17.7% |
| Kiowa | 0.0 /100 | #328 | Tragic 18.3% |
| Colville | 0.0 /100 | #329 | Tragic 18.4% |
| Cajuns | 0.0 /100 | #330 | Tragic 19.1% |
| Paiute | 0.0 /100 | #331 | Tragic 19.3% |
| Natives/Alaskans | 0.0 /100 | #332 | Tragic 19.6% |
| Inupiat | 0.0 /100 | #333 | Tragic 20.0% |
| Pima | 0.0 /100 | #334 | Tragic 20.2% |
| Yuman | 0.0 /100 | #335 | Tragic 21.3% |
| Tohono O'odham | 0.0 /100 | #336 | Tragic 21.6% |
| Apache | 0.0 /100 | #337 | Tragic 21.6% |
| Pueblo | 0.0 /100 | #338 | Tragic 21.6% |
| Arapaho | 0.0 /100 | #339 | Tragic 21.9% |
| Sioux | 0.0 /100 | #340 | Tragic 22.2% |
| Crow | 0.0 /100 | #341 | Tragic 23.3% |