Panamanian vs Austrian Single Male Poverty
COMPARE
Panamanian
Austrian
Single Male Poverty
Single Male Poverty Comparison
Panamanians
Austrians
12.9%
SINGLE MALE POVERTY
37.6/ 100
METRIC RATING
181st/ 347
METRIC RANK
13.1%
SINGLE MALE POVERTY
13.9/ 100
METRIC RATING
216th/ 347
METRIC RANK
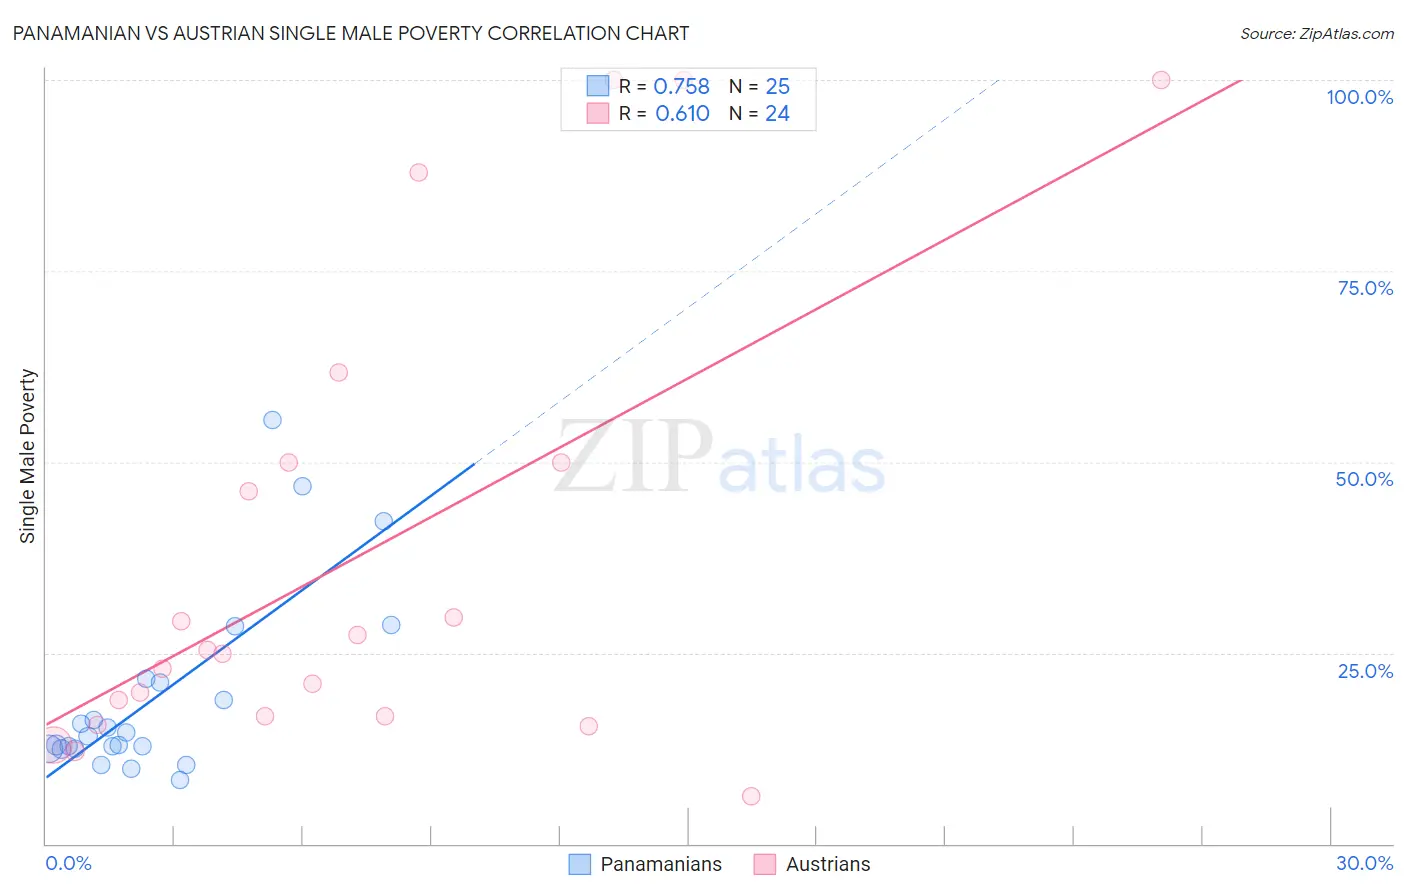
Panamanian vs Austrian Single Male Poverty Correlation Chart
The statistical analysis conducted on geographies consisting of 259,773,019 people shows a strong positive correlation between the proportion of Panamanians and poverty level among single males in the United States with a correlation coefficient (R) of 0.758 and weighted average of 12.9%. Similarly, the statistical analysis conducted on geographies consisting of 387,730,655 people shows a significant positive correlation between the proportion of Austrians and poverty level among single males in the United States with a correlation coefficient (R) of 0.610 and weighted average of 13.1%, a difference of 1.7%.
Single Male Poverty Correlation Summary
| Measurement | Panamanian | Austrian |
| Minimum | 8.3% | 6.2% |
| Maximum | 55.6% | 100.0% |
| Range | 47.2% | 93.8% |
| Mean | 19.2% | 37.9% |
| Median | 14.1% | 25.1% |
| Interquartile 25% (IQ1) | 12.4% | 16.7% |
| Interquartile 75% (IQ3) | 21.4% | 50.0% |
| Interquartile Range (IQR) | 8.9% | 33.3% |
| Standard Deviation (Sample) | 12.2% | 30.2% |
| Standard Deviation (Population) | 12.0% | 29.6% |
Similar Demographics by Single Male Poverty
Demographics Similar to Panamanians by Single Male Poverty
In terms of single male poverty, the demographic groups most similar to Panamanians are Immigrants from North America (12.9%, a difference of 0.010%), Moroccan (12.9%, a difference of 0.040%), Israeli (12.9%, a difference of 0.19%), Immigrants from West Indies (12.9%, a difference of 0.26%), and Immigrants from Trinidad and Tobago (12.9%, a difference of 0.29%).
| Demographics | Rating | Rank | Single Male Poverty |
| Costa Ricans | 50.0 /100 | #174 | Average 12.8% |
| Croatians | 48.9 /100 | #175 | Average 12.8% |
| Syrians | 48.4 /100 | #176 | Average 12.8% |
| Immigrants | Canada | 44.8 /100 | #177 | Average 12.8% |
| Immigrants | Switzerland | 43.1 /100 | #178 | Average 12.8% |
| Israelis | 41.0 /100 | #179 | Average 12.9% |
| Immigrants | North America | 37.7 /100 | #180 | Fair 12.9% |
| Panamanians | 37.6 /100 | #181 | Fair 12.9% |
| Moroccans | 36.8 /100 | #182 | Fair 12.9% |
| Immigrants | West Indies | 33.0 /100 | #183 | Fair 12.9% |
| Immigrants | Trinidad and Tobago | 32.5 /100 | #184 | Fair 12.9% |
| Norwegians | 32.0 /100 | #185 | Fair 12.9% |
| Nigerians | 31.9 /100 | #186 | Fair 12.9% |
| Immigrants | Kuwait | 31.9 /100 | #187 | Fair 12.9% |
| Macedonians | 31.5 /100 | #188 | Fair 12.9% |
Demographics Similar to Austrians by Single Male Poverty
In terms of single male poverty, the demographic groups most similar to Austrians are Japanese (13.1%, a difference of 0.090%), Zimbabwean (13.1%, a difference of 0.10%), Bermudan (13.1%, a difference of 0.10%), Scandinavian (13.1%, a difference of 0.11%), and Immigrants from Burma/Myanmar (13.1%, a difference of 0.15%).
| Demographics | Rating | Rank | Single Male Poverty |
| Mexican American Indians | 17.5 /100 | #209 | Poor 13.1% |
| Immigrants | Haiti | 16.8 /100 | #210 | Poor 13.1% |
| Swedes | 16.8 /100 | #211 | Poor 13.1% |
| Senegalese | 16.4 /100 | #212 | Poor 13.1% |
| Italians | 15.9 /100 | #213 | Poor 13.1% |
| Zimbabweans | 14.9 /100 | #214 | Poor 13.1% |
| Japanese | 14.8 /100 | #215 | Poor 13.1% |
| Austrians | 13.9 /100 | #216 | Poor 13.1% |
| Bermudans | 13.0 /100 | #217 | Poor 13.1% |
| Scandinavians | 12.9 /100 | #218 | Poor 13.1% |
| Immigrants | Burma/Myanmar | 12.6 /100 | #219 | Poor 13.1% |
| Central Americans | 10.9 /100 | #220 | Poor 13.2% |
| New Zealanders | 10.7 /100 | #221 | Poor 13.2% |
| Immigrants | Western Europe | 10.0 /100 | #222 | Poor 13.2% |
| Immigrants | Azores | 9.3 /100 | #223 | Tragic 13.2% |