Immigrants from Peru vs Pima Single Male Poverty
COMPARE
Immigrants from Peru
Pima
Single Male Poverty
Single Male Poverty Comparison
Immigrants from Peru
Pima
11.5%
SINGLE MALE POVERTY
99.9/ 100
METRIC RATING
43rd/ 347
METRIC RANK
20.2%
SINGLE MALE POVERTY
0.0/ 100
METRIC RATING
334th/ 347
METRIC RANK
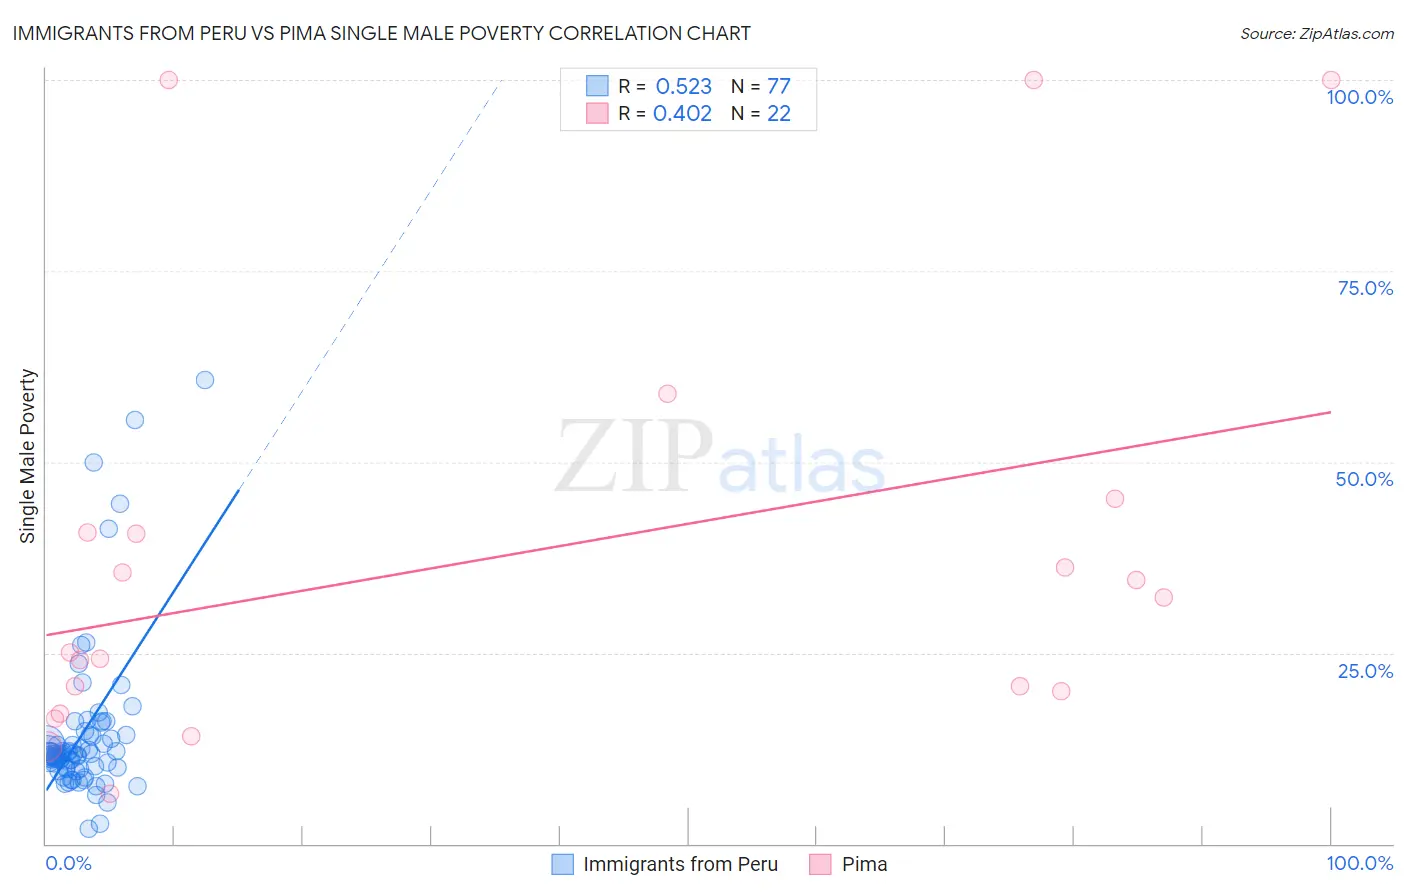
Immigrants from Peru vs Pima Single Male Poverty Correlation Chart
The statistical analysis conducted on geographies consisting of 298,459,351 people shows a substantial positive correlation between the proportion of Immigrants from Peru and poverty level among single males in the United States with a correlation coefficient (R) of 0.523 and weighted average of 11.5%. Similarly, the statistical analysis conducted on geographies consisting of 60,152,261 people shows a moderate positive correlation between the proportion of Pima and poverty level among single males in the United States with a correlation coefficient (R) of 0.402 and weighted average of 20.2%, a difference of 74.5%.
Single Male Poverty Correlation Summary
| Measurement | Immigrants from Peru | Pima |
| Minimum | 1.9% | 6.5% |
| Maximum | 60.7% | 100.0% |
| Range | 58.8% | 93.5% |
| Mean | 14.5% | 37.5% |
| Median | 11.7% | 28.6% |
| Interquartile 25% (IQ1) | 9.9% | 20.0% |
| Interquartile 75% (IQ3) | 14.3% | 40.7% |
| Interquartile Range (IQR) | 4.4% | 20.7% |
| Standard Deviation (Sample) | 10.6% | 28.2% |
| Standard Deviation (Population) | 10.5% | 27.5% |
Similar Demographics by Single Male Poverty
Demographics Similar to Immigrants from Peru by Single Male Poverty
In terms of single male poverty, the demographic groups most similar to Immigrants from Peru are Immigrants from Cameroon (11.5%, a difference of 0.010%), Immigrants from Poland (11.5%, a difference of 0.030%), Egyptian (11.5%, a difference of 0.15%), Immigrants from Bulgaria (11.6%, a difference of 0.16%), and Immigrants from Iraq (11.5%, a difference of 0.20%).
| Demographics | Rating | Rank | Single Male Poverty |
| Immigrants | Serbia | 100.0 /100 | #36 | Exceptional 11.4% |
| Immigrants | Singapore | 100.0 /100 | #37 | Exceptional 11.4% |
| Sri Lankans | 100.0 /100 | #38 | Exceptional 11.5% |
| Soviet Union | 100.0 /100 | #39 | Exceptional 11.5% |
| Immigrants | Korea | 100.0 /100 | #40 | Exceptional 11.5% |
| Immigrants | Iraq | 99.9 /100 | #41 | Exceptional 11.5% |
| Egyptians | 99.9 /100 | #42 | Exceptional 11.5% |
| Immigrants | Peru | 99.9 /100 | #43 | Exceptional 11.5% |
| Immigrants | Cameroon | 99.9 /100 | #44 | Exceptional 11.5% |
| Immigrants | Poland | 99.9 /100 | #45 | Exceptional 11.5% |
| Immigrants | Bulgaria | 99.9 /100 | #46 | Exceptional 11.6% |
| Nepalese | 99.9 /100 | #47 | Exceptional 11.6% |
| Immigrants | Indonesia | 99.9 /100 | #48 | Exceptional 11.6% |
| Tlingit-Haida | 99.9 /100 | #49 | Exceptional 11.6% |
| Immigrants | Lithuania | 99.9 /100 | #50 | Exceptional 11.6% |
Demographics Similar to Pima by Single Male Poverty
In terms of single male poverty, the demographic groups most similar to Pima are Inupiat (20.0%, a difference of 0.80%), Native/Alaskan (19.6%, a difference of 2.7%), Paiute (19.3%, a difference of 4.4%), Cajun (19.1%, a difference of 5.7%), and Yuman (21.3%, a difference of 5.7%).
| Demographics | Rating | Rank | Single Male Poverty |
| Menominee | 0.0 /100 | #327 | Tragic 17.7% |
| Kiowa | 0.0 /100 | #328 | Tragic 18.3% |
| Colville | 0.0 /100 | #329 | Tragic 18.4% |
| Cajuns | 0.0 /100 | #330 | Tragic 19.1% |
| Paiute | 0.0 /100 | #331 | Tragic 19.3% |
| Natives/Alaskans | 0.0 /100 | #332 | Tragic 19.6% |
| Inupiat | 0.0 /100 | #333 | Tragic 20.0% |
| Pima | 0.0 /100 | #334 | Tragic 20.2% |
| Yuman | 0.0 /100 | #335 | Tragic 21.3% |
| Tohono O'odham | 0.0 /100 | #336 | Tragic 21.6% |
| Apache | 0.0 /100 | #337 | Tragic 21.6% |
| Pueblo | 0.0 /100 | #338 | Tragic 21.6% |
| Arapaho | 0.0 /100 | #339 | Tragic 21.9% |
| Sioux | 0.0 /100 | #340 | Tragic 22.2% |
| Crow | 0.0 /100 | #341 | Tragic 23.3% |