African vs Immigrants from Western Africa Single Male Poverty
COMPARE
African
Immigrants from Western Africa
Single Male Poverty
Single Male Poverty Comparison
Africans
Immigrants from Western Africa
14.7%
SINGLE MALE POVERTY
0.0/ 100
METRIC RATING
296th/ 347
METRIC RANK
13.1%
SINGLE MALE POVERTY
17.6/ 100
METRIC RATING
208th/ 347
METRIC RANK
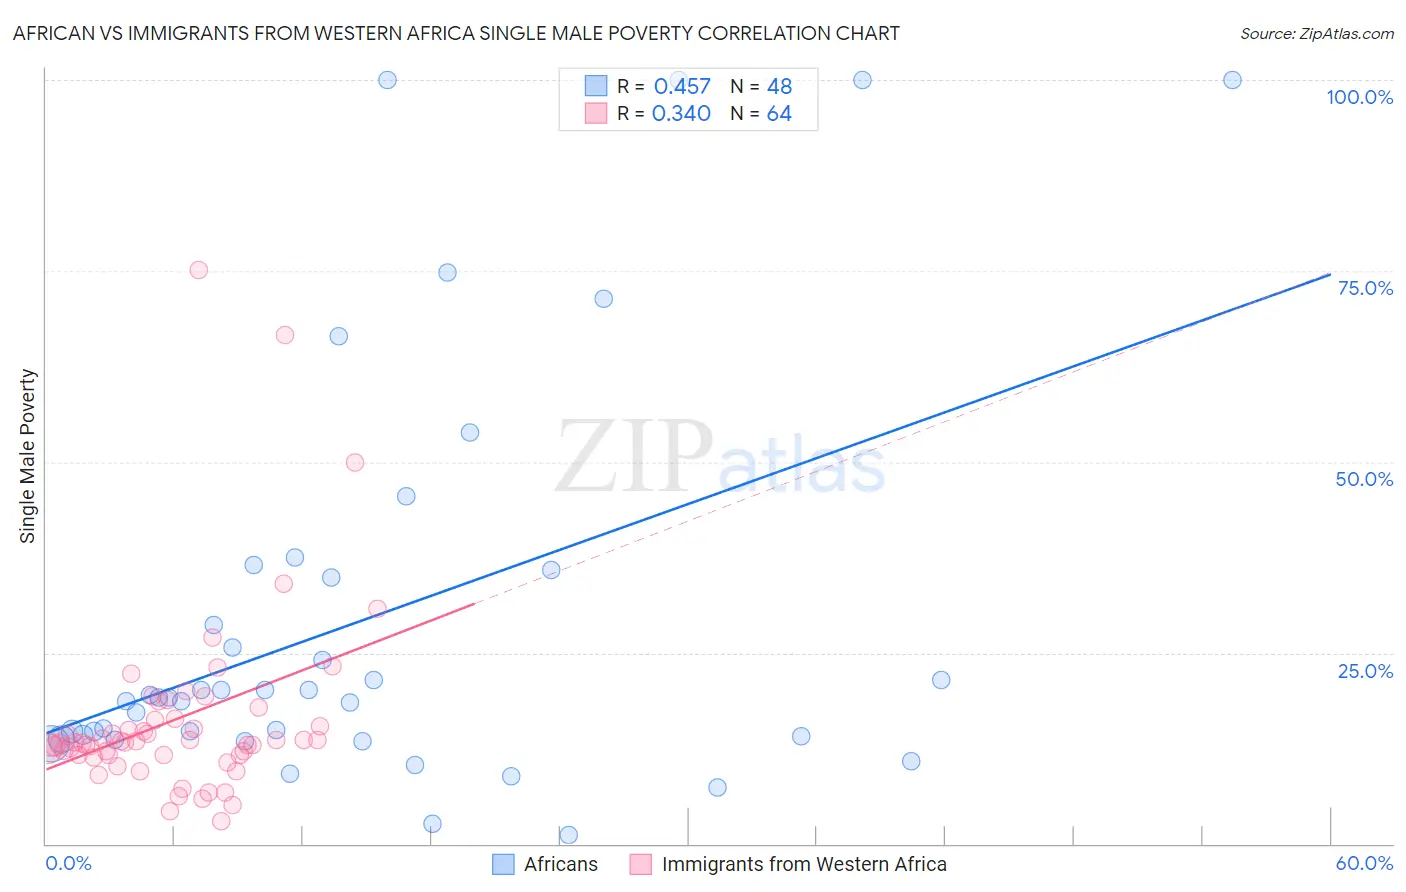
African vs Immigrants from Western Africa Single Male Poverty Correlation Chart
The statistical analysis conducted on geographies consisting of 417,076,777 people shows a moderate positive correlation between the proportion of Africans and poverty level among single males in the United States with a correlation coefficient (R) of 0.457 and weighted average of 14.7%. Similarly, the statistical analysis conducted on geographies consisting of 322,395,283 people shows a mild positive correlation between the proportion of Immigrants from Western Africa and poverty level among single males in the United States with a correlation coefficient (R) of 0.340 and weighted average of 13.1%, a difference of 12.8%.
Single Male Poverty Correlation Summary
| Measurement | African | Immigrants from Western Africa |
| Minimum | 1.1% | 2.9% |
| Maximum | 100.0% | 75.2% |
| Range | 98.9% | 72.3% |
| Mean | 29.4% | 16.2% |
| Median | 19.1% | 13.2% |
| Interquartile 25% (IQ1) | 13.9% | 11.6% |
| Interquartile 75% (IQ3) | 35.4% | 16.3% |
| Interquartile Range (IQR) | 21.5% | 4.7% |
| Standard Deviation (Sample) | 26.8% | 12.3% |
| Standard Deviation (Population) | 26.6% | 12.2% |
Similar Demographics by Single Male Poverty
Demographics Similar to Africans by Single Male Poverty
In terms of single male poverty, the demographic groups most similar to Africans are Scotch-Irish (14.7%, a difference of 0.33%), Immigrants from Dominican Republic (14.8%, a difference of 0.35%), Ottawa (14.6%, a difference of 0.77%), French Canadian (14.6%, a difference of 0.95%), and Nonimmigrants (14.6%, a difference of 1.1%).
| Demographics | Rating | Rank | Single Male Poverty |
| Immigrants | Dominica | 0.0 /100 | #289 | Tragic 14.5% |
| U.S. Virgin Islanders | 0.0 /100 | #290 | Tragic 14.5% |
| Bahamians | 0.0 /100 | #291 | Tragic 14.6% |
| Immigrants | Nonimmigrants | 0.0 /100 | #292 | Tragic 14.6% |
| French Canadians | 0.0 /100 | #293 | Tragic 14.6% |
| Ottawa | 0.0 /100 | #294 | Tragic 14.6% |
| Scotch-Irish | 0.0 /100 | #295 | Tragic 14.7% |
| Africans | 0.0 /100 | #296 | Tragic 14.7% |
| Immigrants | Dominican Republic | 0.0 /100 | #297 | Tragic 14.8% |
| French American Indians | 0.0 /100 | #298 | Tragic 15.0% |
| Delaware | 0.0 /100 | #299 | Tragic 15.0% |
| Cree | 0.0 /100 | #300 | Tragic 15.1% |
| Dominicans | 0.0 /100 | #301 | Tragic 15.2% |
| Alsatians | 0.0 /100 | #302 | Tragic 15.2% |
| Aleuts | 0.0 /100 | #303 | Tragic 15.4% |
Demographics Similar to Immigrants from Western Africa by Single Male Poverty
In terms of single male poverty, the demographic groups most similar to Immigrants from Western Africa are Sudanese (13.1%, a difference of 0.010%), Mexican American Indian (13.1%, a difference of 0.010%), Immigrants from Haiti (13.1%, a difference of 0.070%), Swedish (13.1%, a difference of 0.080%), and Northern European (13.0%, a difference of 0.11%).
| Demographics | Rating | Rank | Single Male Poverty |
| Trinidadians and Tobagonians | 21.4 /100 | #201 | Fair 13.0% |
| Basques | 20.7 /100 | #202 | Fair 13.0% |
| Immigrants | Bangladesh | 20.4 /100 | #203 | Fair 13.0% |
| Estonians | 20.3 /100 | #204 | Fair 13.0% |
| Poles | 19.3 /100 | #205 | Poor 13.0% |
| Northern Europeans | 18.9 /100 | #206 | Poor 13.0% |
| Sudanese | 17.7 /100 | #207 | Poor 13.1% |
| Immigrants | Western Africa | 17.6 /100 | #208 | Poor 13.1% |
| Mexican American Indians | 17.5 /100 | #209 | Poor 13.1% |
| Immigrants | Haiti | 16.8 /100 | #210 | Poor 13.1% |
| Swedes | 16.8 /100 | #211 | Poor 13.1% |
| Senegalese | 16.4 /100 | #212 | Poor 13.1% |
| Italians | 15.9 /100 | #213 | Poor 13.1% |
| Zimbabweans | 14.9 /100 | #214 | Poor 13.1% |
| Japanese | 14.8 /100 | #215 | Poor 13.1% |