Pakistani vs Immigrants from Mexico Female Poverty Among 18-24 Year Olds
COMPARE
Pakistani
Immigrants from Mexico
Female Poverty Among 18-24 Year Olds
Female Poverty Among 18-24 Year Olds Comparison
Pakistanis
Immigrants from Mexico
19.8%
FEMALE POVERTY AMONG 18-24 YEAR OLDS
74.1/ 100
METRIC RATING
160th/ 347
METRIC RANK
20.2%
FEMALE POVERTY AMONG 18-24 YEAR OLDS
36.3/ 100
METRIC RATING
187th/ 347
METRIC RANK
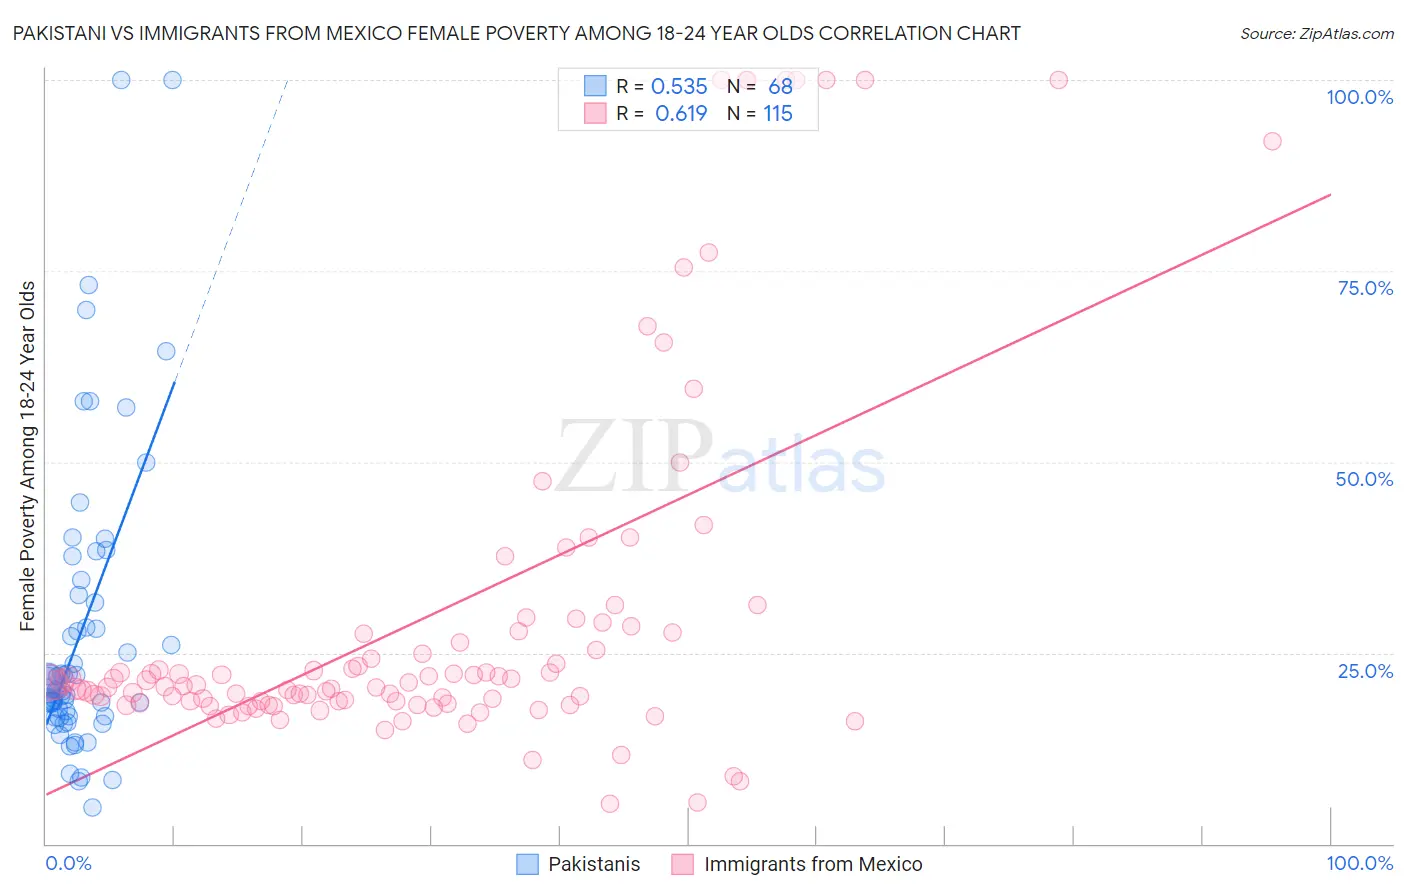
Pakistani vs Immigrants from Mexico Female Poverty Among 18-24 Year Olds Correlation Chart
The statistical analysis conducted on geographies consisting of 330,227,918 people shows a substantial positive correlation between the proportion of Pakistanis and poverty level among females between the ages 18 and 24 in the United States with a correlation coefficient (R) of 0.535 and weighted average of 19.8%. Similarly, the statistical analysis conducted on geographies consisting of 494,801,029 people shows a significant positive correlation between the proportion of Immigrants from Mexico and poverty level among females between the ages 18 and 24 in the United States with a correlation coefficient (R) of 0.619 and weighted average of 20.2%, a difference of 2.0%.
Female Poverty Among 18-24 Year Olds Correlation Summary
| Measurement | Pakistani | Immigrants from Mexico |
| Minimum | 4.7% | 5.3% |
| Maximum | 100.0% | 100.0% |
| Range | 95.3% | 94.7% |
| Mean | 27.7% | 29.8% |
| Median | 20.0% | 20.8% |
| Interquartile 25% (IQ1) | 16.7% | 18.5% |
| Interquartile 75% (IQ3) | 32.0% | 27.7% |
| Interquartile Range (IQR) | 15.4% | 9.2% |
| Standard Deviation (Sample) | 19.5% | 23.6% |
| Standard Deviation (Population) | 19.4% | 23.5% |
Similar Demographics by Female Poverty Among 18-24 Year Olds
Demographics Similar to Pakistanis by Female Poverty Among 18-24 Year Olds
In terms of female poverty among 18-24 year olds, the demographic groups most similar to Pakistanis are Immigrants from Belize (19.8%, a difference of 0.0%), Trinidadian and Tobagonian (19.8%, a difference of 0.020%), French Canadian (19.9%, a difference of 0.070%), Immigrants from Lebanon (19.8%, a difference of 0.080%), and Danish (19.8%, a difference of 0.090%).
| Demographics | Rating | Rank | Female Poverty Among 18-24 Year Olds |
| Immigrants | Japan | 78.1 /100 | #153 | Good 19.8% |
| Immigrants | Zimbabwe | 76.7 /100 | #154 | Good 19.8% |
| Hungarians | 76.6 /100 | #155 | Good 19.8% |
| Immigrants | Belgium | 76.4 /100 | #156 | Good 19.8% |
| Danes | 75.5 /100 | #157 | Good 19.8% |
| Immigrants | Lebanon | 75.3 /100 | #158 | Good 19.8% |
| Trinidadians and Tobagonians | 74.4 /100 | #159 | Good 19.8% |
| Pakistanis | 74.1 /100 | #160 | Good 19.8% |
| Immigrants | Belize | 74.1 /100 | #161 | Good 19.8% |
| French Canadians | 73.0 /100 | #162 | Good 19.9% |
| Malaysians | 72.7 /100 | #163 | Good 19.9% |
| Central Americans | 70.0 /100 | #164 | Good 19.9% |
| Eastern Europeans | 69.3 /100 | #165 | Good 19.9% |
| Belgians | 69.1 /100 | #166 | Good 19.9% |
| Czechoslovakians | 61.8 /100 | #167 | Good 20.0% |
Demographics Similar to Immigrants from Mexico by Female Poverty Among 18-24 Year Olds
In terms of female poverty among 18-24 year olds, the demographic groups most similar to Immigrants from Mexico are Immigrants from Ethiopia (20.2%, a difference of 0.050%), Scandinavian (20.3%, a difference of 0.090%), Immigrants from Germany (20.3%, a difference of 0.12%), Nepalese (20.2%, a difference of 0.17%), and Immigrants from Central America (20.2%, a difference of 0.19%).
| Demographics | Rating | Rank | Female Poverty Among 18-24 Year Olds |
| Iraqis | 43.3 /100 | #180 | Average 20.2% |
| Immigrants | China | 43.0 /100 | #181 | Average 20.2% |
| Immigrants | Barbados | 42.8 /100 | #182 | Average 20.2% |
| Lebanese | 40.6 /100 | #183 | Average 20.2% |
| Immigrants | Central America | 39.9 /100 | #184 | Fair 20.2% |
| Nepalese | 39.7 /100 | #185 | Fair 20.2% |
| Immigrants | Ethiopia | 37.3 /100 | #186 | Fair 20.2% |
| Immigrants | Mexico | 36.3 /100 | #187 | Fair 20.2% |
| Scandinavians | 34.6 /100 | #188 | Fair 20.3% |
| Immigrants | Germany | 34.0 /100 | #189 | Fair 20.3% |
| Immigrants | Western Asia | 29.3 /100 | #190 | Fair 20.3% |
| Moroccans | 25.8 /100 | #191 | Fair 20.4% |
| Immigrants | Israel | 24.4 /100 | #192 | Fair 20.4% |
| Nigerians | 23.4 /100 | #193 | Fair 20.4% |
| Mexican American Indians | 23.2 /100 | #194 | Fair 20.4% |