Pakistani vs Immigrants from Italy Female Poverty Among 18-24 Year Olds
COMPARE
Pakistani
Immigrants from Italy
Female Poverty Among 18-24 Year Olds
Female Poverty Among 18-24 Year Olds Comparison
Pakistanis
Immigrants from Italy
19.8%
FEMALE POVERTY AMONG 18-24 YEAR OLDS
74.1/ 100
METRIC RATING
160th/ 347
METRIC RANK
18.4%
FEMALE POVERTY AMONG 18-24 YEAR OLDS
99.9/ 100
METRIC RATING
57th/ 347
METRIC RANK
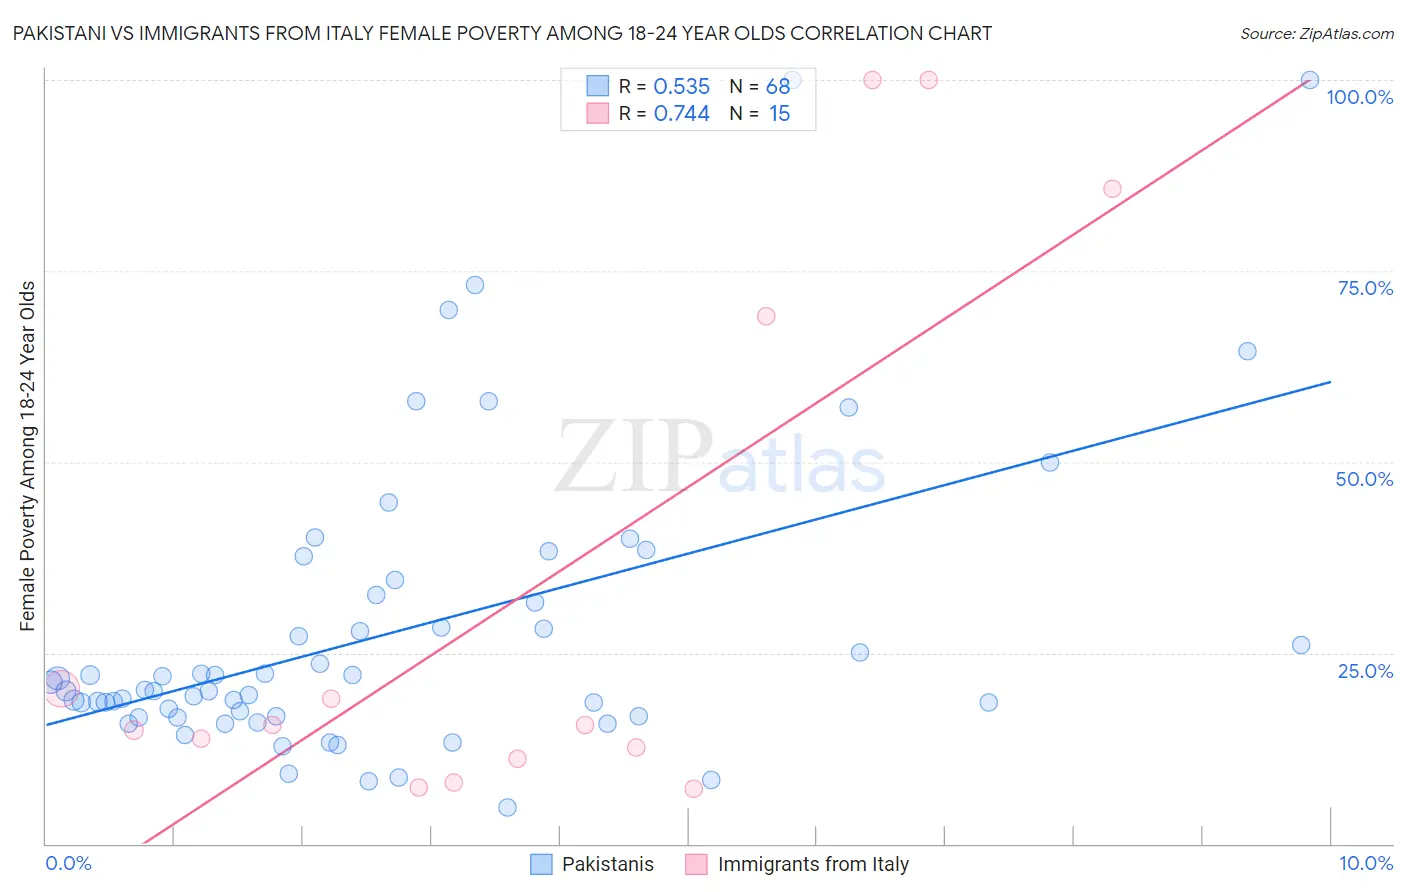
Pakistani vs Immigrants from Italy Female Poverty Among 18-24 Year Olds Correlation Chart
The statistical analysis conducted on geographies consisting of 330,227,918 people shows a substantial positive correlation between the proportion of Pakistanis and poverty level among females between the ages 18 and 24 in the United States with a correlation coefficient (R) of 0.535 and weighted average of 19.8%. Similarly, the statistical analysis conducted on geographies consisting of 314,736,632 people shows a strong positive correlation between the proportion of Immigrants from Italy and poverty level among females between the ages 18 and 24 in the United States with a correlation coefficient (R) of 0.744 and weighted average of 18.4%, a difference of 7.9%.
Female Poverty Among 18-24 Year Olds Correlation Summary
| Measurement | Pakistani | Immigrants from Italy |
| Minimum | 4.7% | 7.2% |
| Maximum | 100.0% | 100.0% |
| Range | 95.3% | 92.8% |
| Mean | 27.7% | 33.3% |
| Median | 20.0% | 15.6% |
| Interquartile 25% (IQ1) | 16.7% | 11.1% |
| Interquartile 75% (IQ3) | 32.0% | 69.1% |
| Interquartile Range (IQR) | 15.4% | 58.1% |
| Standard Deviation (Sample) | 19.5% | 35.4% |
| Standard Deviation (Population) | 19.4% | 34.2% |
Similar Demographics by Female Poverty Among 18-24 Year Olds
Demographics Similar to Pakistanis by Female Poverty Among 18-24 Year Olds
In terms of female poverty among 18-24 year olds, the demographic groups most similar to Pakistanis are Immigrants from Belize (19.8%, a difference of 0.0%), Trinidadian and Tobagonian (19.8%, a difference of 0.020%), French Canadian (19.9%, a difference of 0.070%), Immigrants from Lebanon (19.8%, a difference of 0.080%), and Danish (19.8%, a difference of 0.090%).
| Demographics | Rating | Rank | Female Poverty Among 18-24 Year Olds |
| Immigrants | Japan | 78.1 /100 | #153 | Good 19.8% |
| Immigrants | Zimbabwe | 76.7 /100 | #154 | Good 19.8% |
| Hungarians | 76.6 /100 | #155 | Good 19.8% |
| Immigrants | Belgium | 76.4 /100 | #156 | Good 19.8% |
| Danes | 75.5 /100 | #157 | Good 19.8% |
| Immigrants | Lebanon | 75.3 /100 | #158 | Good 19.8% |
| Trinidadians and Tobagonians | 74.4 /100 | #159 | Good 19.8% |
| Pakistanis | 74.1 /100 | #160 | Good 19.8% |
| Immigrants | Belize | 74.1 /100 | #161 | Good 19.8% |
| French Canadians | 73.0 /100 | #162 | Good 19.9% |
| Malaysians | 72.7 /100 | #163 | Good 19.9% |
| Central Americans | 70.0 /100 | #164 | Good 19.9% |
| Eastern Europeans | 69.3 /100 | #165 | Good 19.9% |
| Belgians | 69.1 /100 | #166 | Good 19.9% |
| Czechoslovakians | 61.8 /100 | #167 | Good 20.0% |
Demographics Similar to Immigrants from Italy by Female Poverty Among 18-24 Year Olds
In terms of female poverty among 18-24 year olds, the demographic groups most similar to Immigrants from Italy are Immigrants from Ukraine (18.4%, a difference of 0.060%), Argentinean (18.4%, a difference of 0.10%), Albanian (18.4%, a difference of 0.12%), Immigrants from Egypt (18.4%, a difference of 0.13%), and Italian (18.3%, a difference of 0.35%).
| Demographics | Rating | Rank | Female Poverty Among 18-24 Year Olds |
| Samoans | 100.0 /100 | #50 | Exceptional 18.2% |
| Immigrants | Eastern Europe | 99.9 /100 | #51 | Exceptional 18.2% |
| Immigrants | Ireland | 99.9 /100 | #52 | Exceptional 18.3% |
| Italians | 99.9 /100 | #53 | Exceptional 18.3% |
| Immigrants | Egypt | 99.9 /100 | #54 | Exceptional 18.4% |
| Albanians | 99.9 /100 | #55 | Exceptional 18.4% |
| Argentineans | 99.9 /100 | #56 | Exceptional 18.4% |
| Immigrants | Italy | 99.9 /100 | #57 | Exceptional 18.4% |
| Immigrants | Ukraine | 99.9 /100 | #58 | Exceptional 18.4% |
| Egyptians | 99.9 /100 | #59 | Exceptional 18.5% |
| Immigrants | Brazil | 99.8 /100 | #60 | Exceptional 18.5% |
| Immigrants | Albania | 99.8 /100 | #61 | Exceptional 18.5% |
| Greeks | 99.8 /100 | #62 | Exceptional 18.5% |
| Immigrants | Belarus | 99.8 /100 | #63 | Exceptional 18.5% |
| Immigrants | Asia | 99.8 /100 | #64 | Exceptional 18.6% |