Bermudan vs Immigrants from Denmark Female Poverty Among 18-24 Year Olds
COMPARE
Bermudan
Immigrants from Denmark
Female Poverty Among 18-24 Year Olds
Female Poverty Among 18-24 Year Olds Comparison
Bermudans
Immigrants from Denmark
21.9%
FEMALE POVERTY AMONG 18-24 YEAR OLDS
0.1/ 100
METRIC RATING
282nd/ 347
METRIC RANK
20.8%
FEMALE POVERTY AMONG 18-24 YEAR OLDS
5.8/ 100
METRIC RATING
233rd/ 347
METRIC RANK
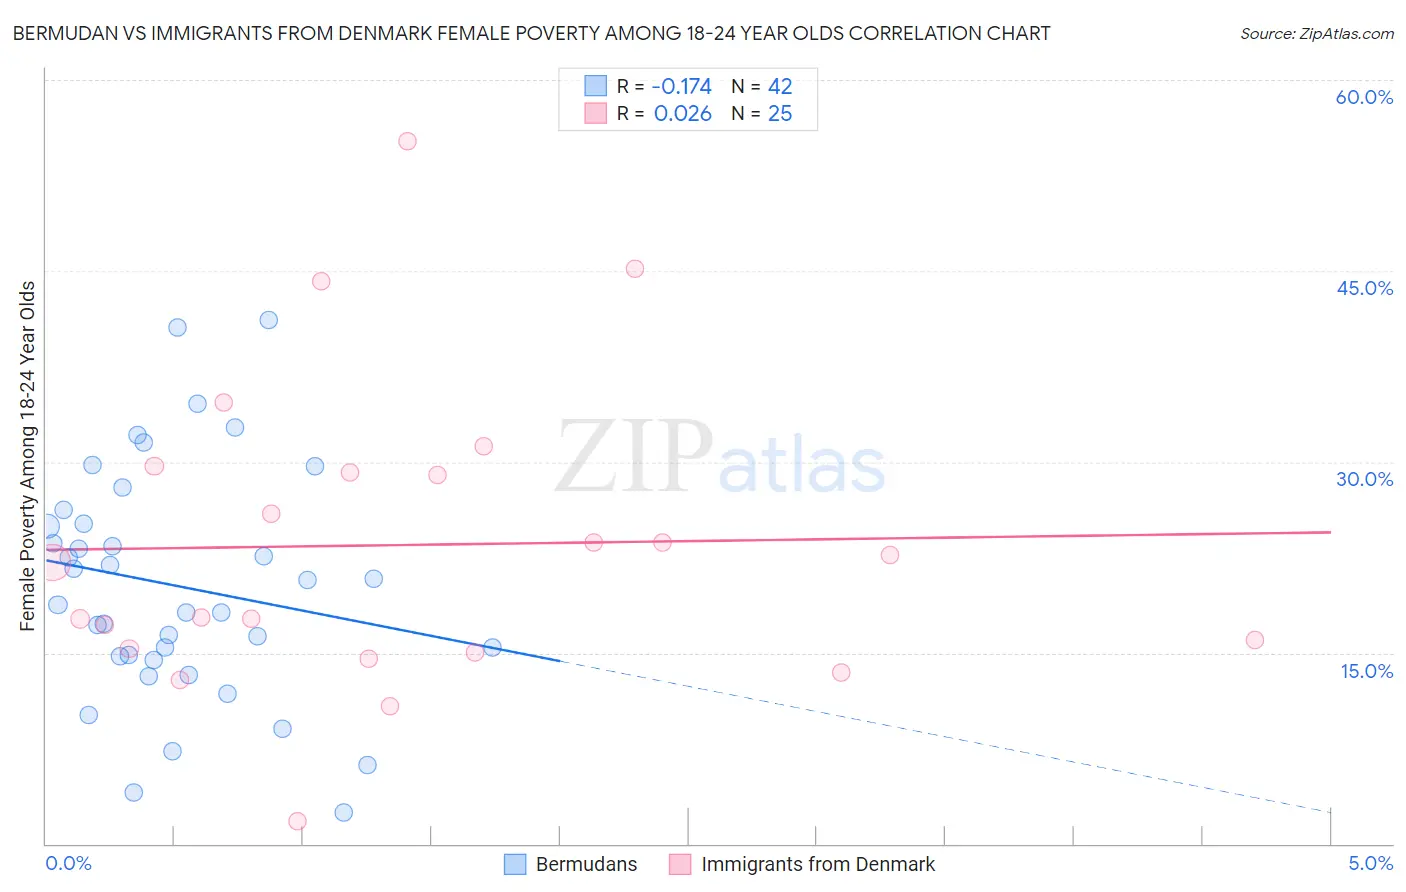
Bermudan vs Immigrants from Denmark Female Poverty Among 18-24 Year Olds Correlation Chart
The statistical analysis conducted on geographies consisting of 55,519,020 people shows a poor negative correlation between the proportion of Bermudans and poverty level among females between the ages 18 and 24 in the United States with a correlation coefficient (R) of -0.174 and weighted average of 21.9%. Similarly, the statistical analysis conducted on geographies consisting of 134,710,219 people shows no correlation between the proportion of Immigrants from Denmark and poverty level among females between the ages 18 and 24 in the United States with a correlation coefficient (R) of 0.026 and weighted average of 20.8%, a difference of 5.6%.
Female Poverty Among 18-24 Year Olds Correlation Summary
| Measurement | Bermudan | Immigrants from Denmark |
| Minimum | 2.4% | 1.8% |
| Maximum | 41.1% | 55.2% |
| Range | 38.7% | 53.4% |
| Mean | 20.3% | 23.5% |
| Median | 19.8% | 22.1% |
| Interquartile 25% (IQ1) | 14.7% | 15.2% |
| Interquartile 75% (IQ3) | 25.1% | 29.4% |
| Interquartile Range (IQR) | 10.4% | 14.2% |
| Standard Deviation (Sample) | 9.1% | 12.0% |
| Standard Deviation (Population) | 9.0% | 11.8% |
Similar Demographics by Female Poverty Among 18-24 Year Olds
Demographics Similar to Bermudans by Female Poverty Among 18-24 Year Olds
In terms of female poverty among 18-24 year olds, the demographic groups most similar to Bermudans are Immigrants from Dominican Republic (21.9%, a difference of 0.090%), Immigrants from Dominica (21.9%, a difference of 0.13%), Spanish American (21.9%, a difference of 0.14%), Subsaharan African (22.0%, a difference of 0.30%), and Yaqui (21.9%, a difference of 0.31%).
| Demographics | Rating | Rank | Female Poverty Among 18-24 Year Olds |
| Immigrants | Bangladesh | 0.1 /100 | #275 | Tragic 21.8% |
| Bahamians | 0.1 /100 | #276 | Tragic 21.8% |
| Immigrants | Switzerland | 0.1 /100 | #277 | Tragic 21.8% |
| Yaqui | 0.1 /100 | #278 | Tragic 21.9% |
| Spanish Americans | 0.1 /100 | #279 | Tragic 21.9% |
| Immigrants | Dominica | 0.1 /100 | #280 | Tragic 21.9% |
| Immigrants | Dominican Republic | 0.1 /100 | #281 | Tragic 21.9% |
| Bermudans | 0.1 /100 | #282 | Tragic 21.9% |
| Sub-Saharan Africans | 0.0 /100 | #283 | Tragic 22.0% |
| Tlingit-Haida | 0.0 /100 | #284 | Tragic 22.0% |
| Ottawa | 0.0 /100 | #285 | Tragic 22.0% |
| Ugandans | 0.0 /100 | #286 | Tragic 22.1% |
| Immigrants | Middle Africa | 0.0 /100 | #287 | Tragic 22.1% |
| Dominicans | 0.0 /100 | #288 | Tragic 22.3% |
| French American Indians | 0.0 /100 | #289 | Tragic 22.3% |
Demographics Similar to Immigrants from Denmark by Female Poverty Among 18-24 Year Olds
In terms of female poverty among 18-24 year olds, the demographic groups most similar to Immigrants from Denmark are Finnish (20.8%, a difference of 0.030%), Immigrants from St. Vincent and the Grenadines (20.8%, a difference of 0.040%), Australian (20.8%, a difference of 0.060%), White/Caucasian (20.8%, a difference of 0.060%), and Welsh (20.8%, a difference of 0.10%).
| Demographics | Rating | Rank | Female Poverty Among 18-24 Year Olds |
| Estonians | 7.2 /100 | #226 | Tragic 20.7% |
| Immigrants | Sweden | 6.8 /100 | #227 | Tragic 20.7% |
| Ghanaians | 6.5 /100 | #228 | Tragic 20.8% |
| Australians | 6.1 /100 | #229 | Tragic 20.8% |
| Whites/Caucasians | 6.1 /100 | #230 | Tragic 20.8% |
| Immigrants | St. Vincent and the Grenadines | 6.0 /100 | #231 | Tragic 20.8% |
| Finns | 6.0 /100 | #232 | Tragic 20.8% |
| Immigrants | Denmark | 5.8 /100 | #233 | Tragic 20.8% |
| Welsh | 5.4 /100 | #234 | Tragic 20.8% |
| Immigrants | Uganda | 5.1 /100 | #235 | Tragic 20.8% |
| Okinawans | 4.9 /100 | #236 | Tragic 20.8% |
| Scottish | 4.5 /100 | #237 | Tragic 20.9% |
| Immigrants | Singapore | 4.4 /100 | #238 | Tragic 20.9% |
| Immigrants | Guatemala | 4.3 /100 | #239 | Tragic 20.9% |
| Luxembourgers | 4.2 /100 | #240 | Tragic 20.9% |