Pakistani vs Iraqi Female Poverty Among 18-24 Year Olds
COMPARE
Pakistani
Iraqi
Female Poverty Among 18-24 Year Olds
Female Poverty Among 18-24 Year Olds Comparison
Pakistanis
Iraqis
19.8%
FEMALE POVERTY AMONG 18-24 YEAR OLDS
74.1/ 100
METRIC RATING
160th/ 347
METRIC RANK
20.2%
FEMALE POVERTY AMONG 18-24 YEAR OLDS
43.3/ 100
METRIC RATING
180th/ 347
METRIC RANK
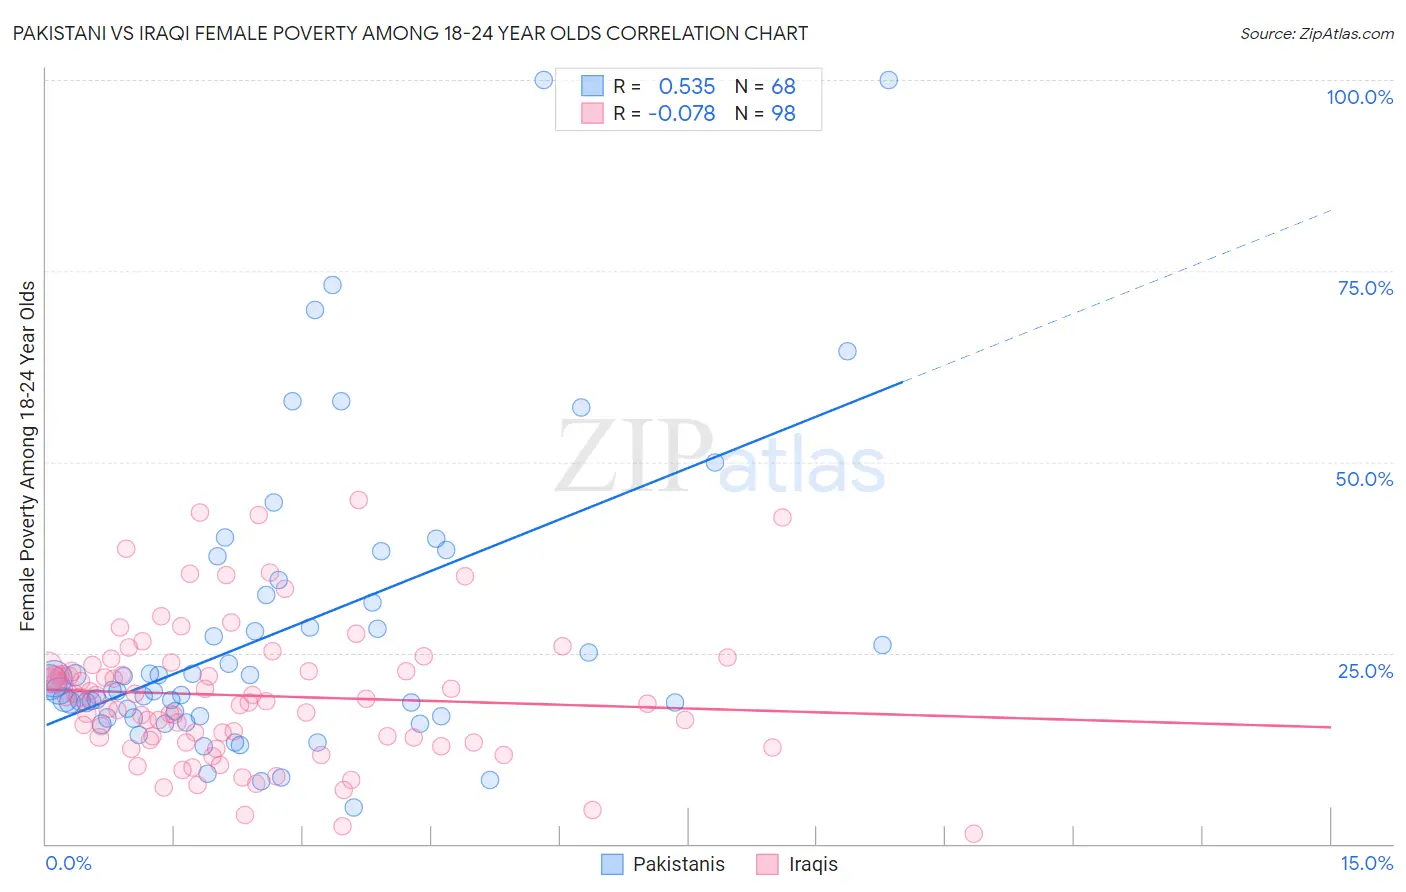
Pakistani vs Iraqi Female Poverty Among 18-24 Year Olds Correlation Chart
The statistical analysis conducted on geographies consisting of 330,227,918 people shows a substantial positive correlation between the proportion of Pakistanis and poverty level among females between the ages 18 and 24 in the United States with a correlation coefficient (R) of 0.535 and weighted average of 19.8%. Similarly, the statistical analysis conducted on geographies consisting of 169,269,005 people shows a slight negative correlation between the proportion of Iraqis and poverty level among females between the ages 18 and 24 in the United States with a correlation coefficient (R) of -0.078 and weighted average of 20.2%, a difference of 1.6%.
Female Poverty Among 18-24 Year Olds Correlation Summary
| Measurement | Pakistani | Iraqi |
| Minimum | 4.7% | 1.3% |
| Maximum | 100.0% | 45.1% |
| Range | 95.3% | 43.8% |
| Mean | 27.7% | 19.4% |
| Median | 20.0% | 18.9% |
| Interquartile 25% (IQ1) | 16.7% | 13.5% |
| Interquartile 75% (IQ3) | 32.0% | 23.2% |
| Interquartile Range (IQR) | 15.4% | 9.6% |
| Standard Deviation (Sample) | 19.5% | 9.0% |
| Standard Deviation (Population) | 19.4% | 9.0% |
Demographics Similar to Pakistanis and Iraqis by Female Poverty Among 18-24 Year Olds
In terms of female poverty among 18-24 year olds, the demographic groups most similar to Pakistanis are Immigrants from Belize (19.8%, a difference of 0.0%), French Canadian (19.9%, a difference of 0.070%), Malaysian (19.9%, a difference of 0.090%), Central American (19.9%, a difference of 0.26%), and Eastern European (19.9%, a difference of 0.30%). Similarly, the demographic groups most similar to Iraqis are Ethiopian (20.2%, a difference of 0.020%), Swiss (20.2%, a difference of 0.030%), Immigrants from Kazakhstan (20.2%, a difference of 0.040%), Kenyan (20.2%, a difference of 0.080%), and South American Indian (20.1%, a difference of 0.25%).
| Demographics | Rating | Rank | Female Poverty Among 18-24 Year Olds |
| Pakistanis | 74.1 /100 | #160 | Good 19.8% |
| Immigrants | Belize | 74.1 /100 | #161 | Good 19.8% |
| French Canadians | 73.0 /100 | #162 | Good 19.9% |
| Malaysians | 72.7 /100 | #163 | Good 19.9% |
| Central Americans | 70.0 /100 | #164 | Good 19.9% |
| Eastern Europeans | 69.3 /100 | #165 | Good 19.9% |
| Belgians | 69.1 /100 | #166 | Good 19.9% |
| Czechoslovakians | 61.8 /100 | #167 | Good 20.0% |
| Fijians | 59.1 /100 | #168 | Average 20.0% |
| Hmong | 55.4 /100 | #169 | Average 20.0% |
| Iranians | 54.7 /100 | #170 | Average 20.1% |
| Immigrants | Nigeria | 54.3 /100 | #171 | Average 20.1% |
| Belizeans | 52.0 /100 | #172 | Average 20.1% |
| Irish | 50.0 /100 | #173 | Average 20.1% |
| Swedes | 50.0 /100 | #174 | Average 20.1% |
| South American Indians | 48.4 /100 | #175 | Average 20.1% |
| Kenyans | 44.9 /100 | #176 | Average 20.2% |
| Immigrants | Kazakhstan | 44.2 /100 | #177 | Average 20.2% |
| Swiss | 44.0 /100 | #178 | Average 20.2% |
| Ethiopians | 43.8 /100 | #179 | Average 20.2% |
| Iraqis | 43.3 /100 | #180 | Average 20.2% |