Pueblo vs Immigrants from Denmark Female Poverty Among 18-24 Year Olds
COMPARE
Pueblo
Immigrants from Denmark
Female Poverty Among 18-24 Year Olds
Female Poverty Among 18-24 Year Olds Comparison
Pueblo
Immigrants from Denmark
26.9%
FEMALE POVERTY AMONG 18-24 YEAR OLDS
0.0/ 100
METRIC RATING
334th/ 347
METRIC RANK
20.8%
FEMALE POVERTY AMONG 18-24 YEAR OLDS
5.8/ 100
METRIC RATING
233rd/ 347
METRIC RANK
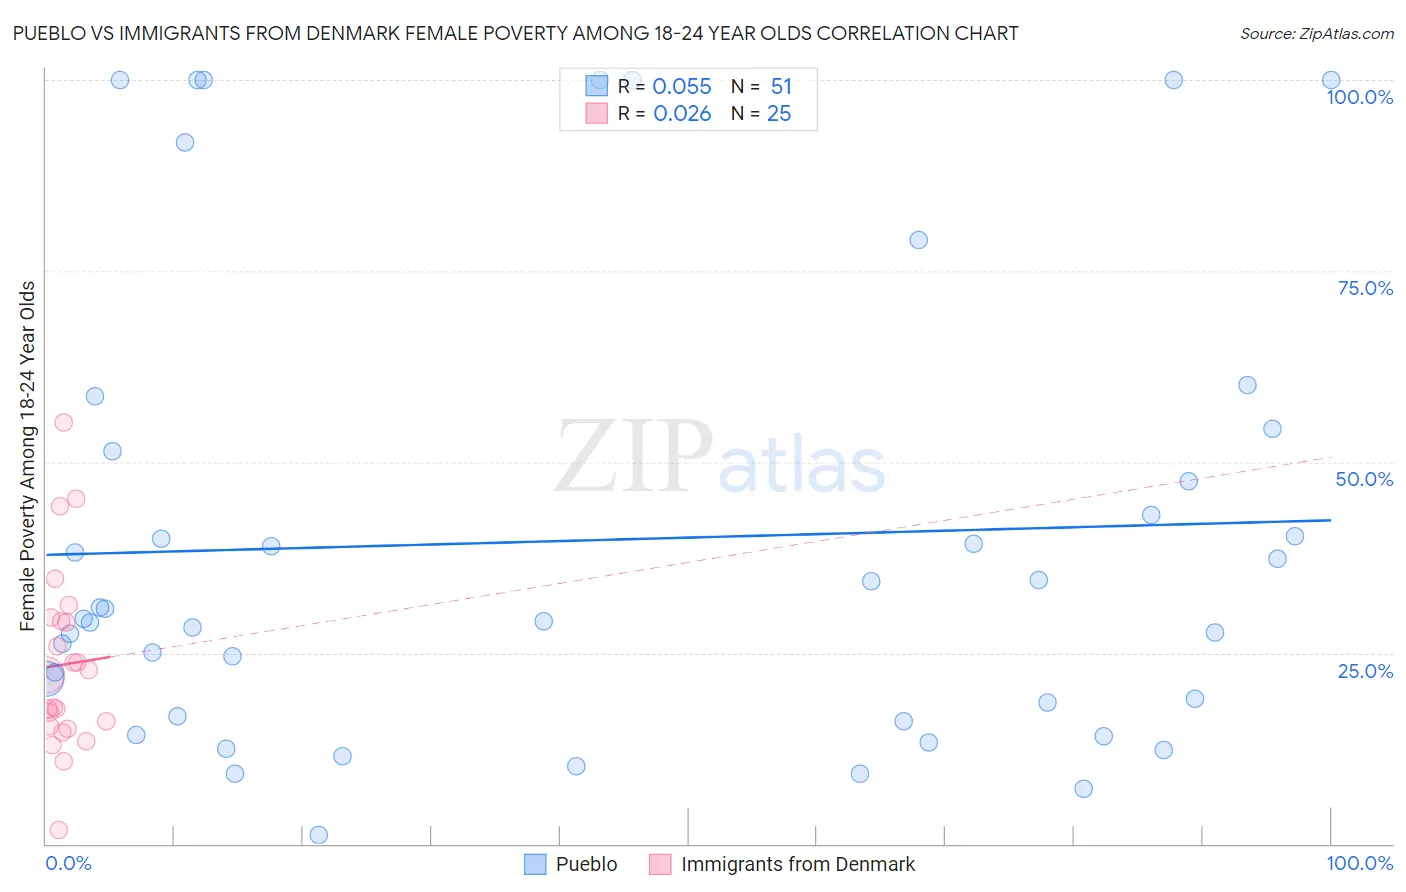
Pueblo vs Immigrants from Denmark Female Poverty Among 18-24 Year Olds Correlation Chart
The statistical analysis conducted on geographies consisting of 119,346,276 people shows a slight positive correlation between the proportion of Pueblo and poverty level among females between the ages 18 and 24 in the United States with a correlation coefficient (R) of 0.055 and weighted average of 26.9%. Similarly, the statistical analysis conducted on geographies consisting of 134,710,219 people shows no correlation between the proportion of Immigrants from Denmark and poverty level among females between the ages 18 and 24 in the United States with a correlation coefficient (R) of 0.026 and weighted average of 20.8%, a difference of 29.4%.
Female Poverty Among 18-24 Year Olds Correlation Summary
| Measurement | Pueblo | Immigrants from Denmark |
| Minimum | 1.1% | 1.8% |
| Maximum | 100.0% | 55.2% |
| Range | 98.9% | 53.4% |
| Mean | 39.7% | 23.5% |
| Median | 29.4% | 22.1% |
| Interquartile 25% (IQ1) | 16.7% | 15.2% |
| Interquartile 75% (IQ3) | 51.5% | 29.4% |
| Interquartile Range (IQR) | 34.8% | 14.2% |
| Standard Deviation (Sample) | 29.9% | 12.0% |
| Standard Deviation (Population) | 29.6% | 11.8% |
Similar Demographics by Female Poverty Among 18-24 Year Olds
Demographics Similar to Pueblo by Female Poverty Among 18-24 Year Olds
In terms of female poverty among 18-24 year olds, the demographic groups most similar to Pueblo are Yup'ik (27.0%, a difference of 0.45%), Apache (26.3%, a difference of 2.2%), Immigrants from Yemen (27.5%, a difference of 2.4%), Houma (26.2%, a difference of 2.8%), and Chippewa (25.9%, a difference of 3.8%).
| Demographics | Rating | Rank | Female Poverty Among 18-24 Year Olds |
| Ute | 0.0 /100 | #327 | Tragic 25.4% |
| Natives/Alaskans | 0.0 /100 | #328 | Tragic 25.4% |
| Cajuns | 0.0 /100 | #329 | Tragic 25.7% |
| Immigrants | Somalia | 0.0 /100 | #330 | Tragic 25.7% |
| Chippewa | 0.0 /100 | #331 | Tragic 25.9% |
| Houma | 0.0 /100 | #332 | Tragic 26.2% |
| Apache | 0.0 /100 | #333 | Tragic 26.3% |
| Pueblo | 0.0 /100 | #334 | Tragic 26.9% |
| Yup'ik | 0.0 /100 | #335 | Tragic 27.0% |
| Immigrants | Yemen | 0.0 /100 | #336 | Tragic 27.5% |
| Cheyenne | 0.0 /100 | #337 | Tragic 28.1% |
| Hopi | 0.0 /100 | #338 | Tragic 28.2% |
| Pima | 0.0 /100 | #339 | Tragic 28.4% |
| Sioux | 0.0 /100 | #340 | Tragic 28.6% |
| Colville | 0.0 /100 | #341 | Tragic 29.0% |
Demographics Similar to Immigrants from Denmark by Female Poverty Among 18-24 Year Olds
In terms of female poverty among 18-24 year olds, the demographic groups most similar to Immigrants from Denmark are Finnish (20.8%, a difference of 0.030%), Immigrants from St. Vincent and the Grenadines (20.8%, a difference of 0.040%), Australian (20.8%, a difference of 0.060%), White/Caucasian (20.8%, a difference of 0.060%), and Welsh (20.8%, a difference of 0.10%).
| Demographics | Rating | Rank | Female Poverty Among 18-24 Year Olds |
| Estonians | 7.2 /100 | #226 | Tragic 20.7% |
| Immigrants | Sweden | 6.8 /100 | #227 | Tragic 20.7% |
| Ghanaians | 6.5 /100 | #228 | Tragic 20.8% |
| Australians | 6.1 /100 | #229 | Tragic 20.8% |
| Whites/Caucasians | 6.1 /100 | #230 | Tragic 20.8% |
| Immigrants | St. Vincent and the Grenadines | 6.0 /100 | #231 | Tragic 20.8% |
| Finns | 6.0 /100 | #232 | Tragic 20.8% |
| Immigrants | Denmark | 5.8 /100 | #233 | Tragic 20.8% |
| Welsh | 5.4 /100 | #234 | Tragic 20.8% |
| Immigrants | Uganda | 5.1 /100 | #235 | Tragic 20.8% |
| Okinawans | 4.9 /100 | #236 | Tragic 20.8% |
| Scottish | 4.5 /100 | #237 | Tragic 20.9% |
| Immigrants | Singapore | 4.4 /100 | #238 | Tragic 20.9% |
| Immigrants | Guatemala | 4.3 /100 | #239 | Tragic 20.9% |
| Luxembourgers | 4.2 /100 | #240 | Tragic 20.9% |