Pakistani vs Immigrants from the Azores Family Households with Children
COMPARE
Pakistani
Immigrants from the Azores
Family Households with Children
Family Households with Children Comparison
Pakistanis
Immigrants from the Azores
27.9%
FAMILY HOUSEHOLDS WITH CHILDREN
96.0/ 100
METRIC RATING
116th/ 347
METRIC RANK
28.1%
FAMILY HOUSEHOLDS WITH CHILDREN
98.8/ 100
METRIC RATING
99th/ 347
METRIC RANK
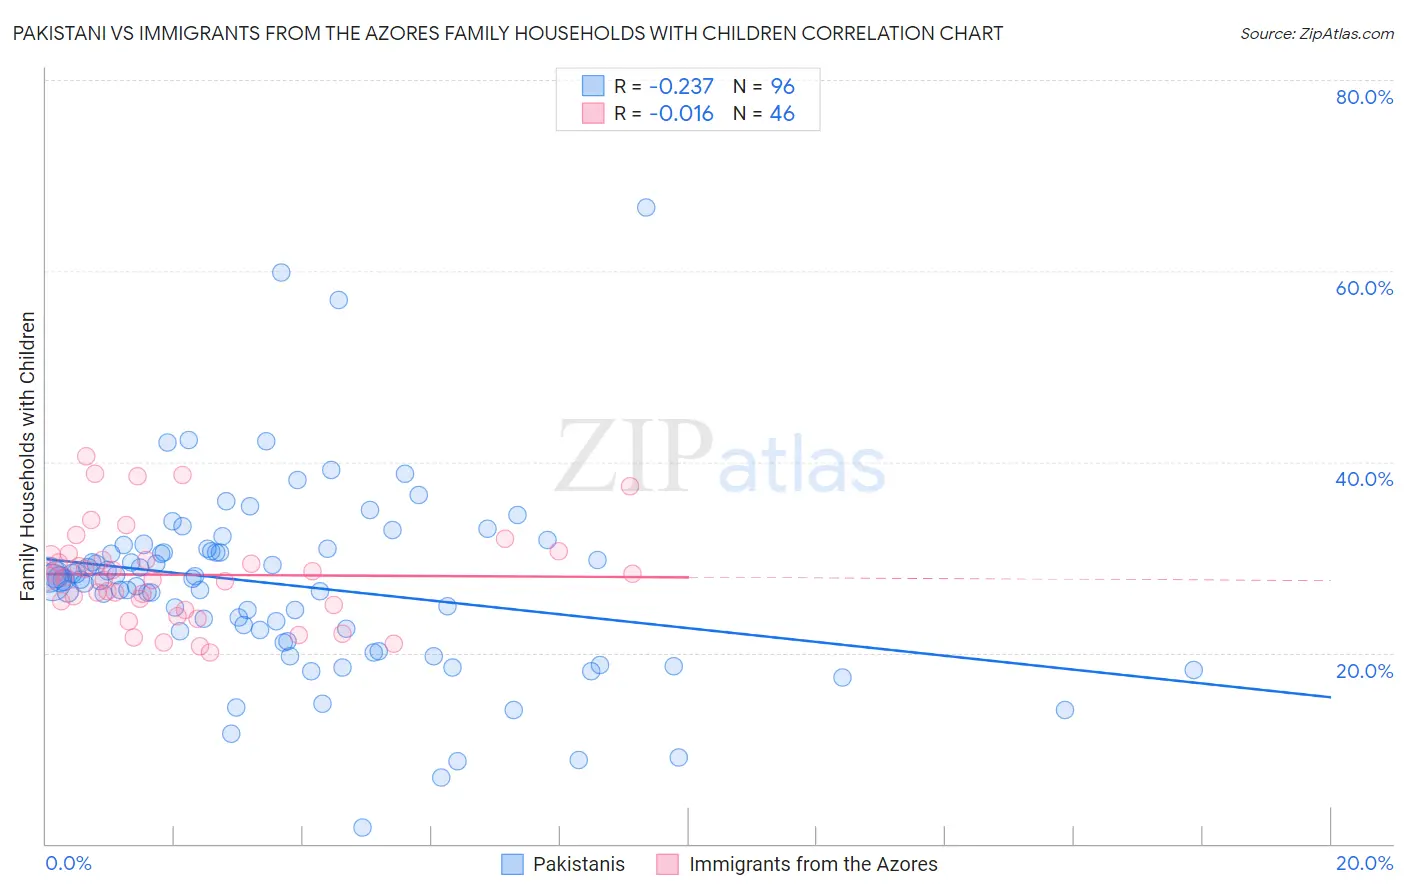
Pakistani vs Immigrants from the Azores Family Households with Children Correlation Chart
The statistical analysis conducted on geographies consisting of 335,080,458 people shows a weak negative correlation between the proportion of Pakistanis and percentage of family households with children in the United States with a correlation coefficient (R) of -0.237 and weighted average of 27.9%. Similarly, the statistical analysis conducted on geographies consisting of 46,253,049 people shows no correlation between the proportion of Immigrants from the Azores and percentage of family households with children in the United States with a correlation coefficient (R) of -0.016 and weighted average of 28.1%, a difference of 0.69%.
Family Households with Children Correlation Summary
| Measurement | Pakistani | Immigrants from the Azores |
| Minimum | 1.7% | 20.0% |
| Maximum | 66.6% | 40.6% |
| Range | 64.9% | 20.6% |
| Mean | 27.1% | 28.2% |
| Median | 27.7% | 27.8% |
| Interquartile 25% (IQ1) | 21.8% | 25.0% |
| Interquartile 75% (IQ3) | 30.7% | 30.3% |
| Interquartile Range (IQR) | 9.0% | 5.2% |
| Standard Deviation (Sample) | 9.9% | 5.1% |
| Standard Deviation (Population) | 9.9% | 5.0% |
Demographics Similar to Pakistanis and Immigrants from the Azores by Family Households with Children
In terms of family households with children, the demographic groups most similar to Pakistanis are Immigrants from Malaysia (27.9%, a difference of 0.010%), Immigrants from Africa (28.0%, a difference of 0.13%), South American Indian (28.0%, a difference of 0.14%), Arab (28.0%, a difference of 0.16%), and Immigrants from Middle Africa (28.0%, a difference of 0.17%). Similarly, the demographic groups most similar to Immigrants from the Azores are Indonesian (28.1%, a difference of 0.0%), Immigrants from Kenya (28.1%, a difference of 0.010%), Immigrants from Oceania (28.1%, a difference of 0.020%), Chilean (28.1%, a difference of 0.050%), and Assyrian/Chaldean/Syriac (28.1%, a difference of 0.050%).
| Demographics | Rating | Rank | Family Households with Children |
| Chileans | 98.9 /100 | #97 | Exceptional 28.1% |
| Immigrants | Kenya | 98.9 /100 | #98 | Exceptional 28.1% |
| Immigrants | Azores | 98.8 /100 | #99 | Exceptional 28.1% |
| Indonesians | 98.8 /100 | #100 | Exceptional 28.1% |
| Immigrants | Oceania | 98.8 /100 | #101 | Exceptional 28.1% |
| Assyrians/Chaldeans/Syriacs | 98.7 /100 | #102 | Exceptional 28.1% |
| Palestinians | 98.5 /100 | #103 | Exceptional 28.1% |
| Sioux | 98.3 /100 | #104 | Exceptional 28.1% |
| Choctaw | 98.3 /100 | #105 | Exceptional 28.1% |
| Immigrants | South America | 98.0 /100 | #106 | Exceptional 28.0% |
| Immigrants | Uganda | 97.7 /100 | #107 | Exceptional 28.0% |
| Immigrants | Burma/Myanmar | 97.7 /100 | #108 | Exceptional 28.0% |
| Tohono O'odham | 97.6 /100 | #109 | Exceptional 28.0% |
| Spaniards | 97.4 /100 | #110 | Exceptional 28.0% |
| Scandinavians | 97.1 /100 | #111 | Exceptional 28.0% |
| Immigrants | Middle Africa | 97.0 /100 | #112 | Exceptional 28.0% |
| Arabs | 97.0 /100 | #113 | Exceptional 28.0% |
| South American Indians | 96.9 /100 | #114 | Exceptional 28.0% |
| Immigrants | Africa | 96.8 /100 | #115 | Exceptional 28.0% |
| Pakistanis | 96.0 /100 | #116 | Exceptional 27.9% |
| Immigrants | Malaysia | 95.9 /100 | #117 | Exceptional 27.9% |