Paiute vs Spanish Single Male Poverty
COMPARE
Paiute
Spanish
Single Male Poverty
Single Male Poverty Comparison
Paiute
Spanish
19.3%
SINGLE MALE POVERTY
0.0/ 100
METRIC RATING
331st/ 347
METRIC RANK
13.6%
SINGLE MALE POVERTY
1.0/ 100
METRIC RATING
249th/ 347
METRIC RANK
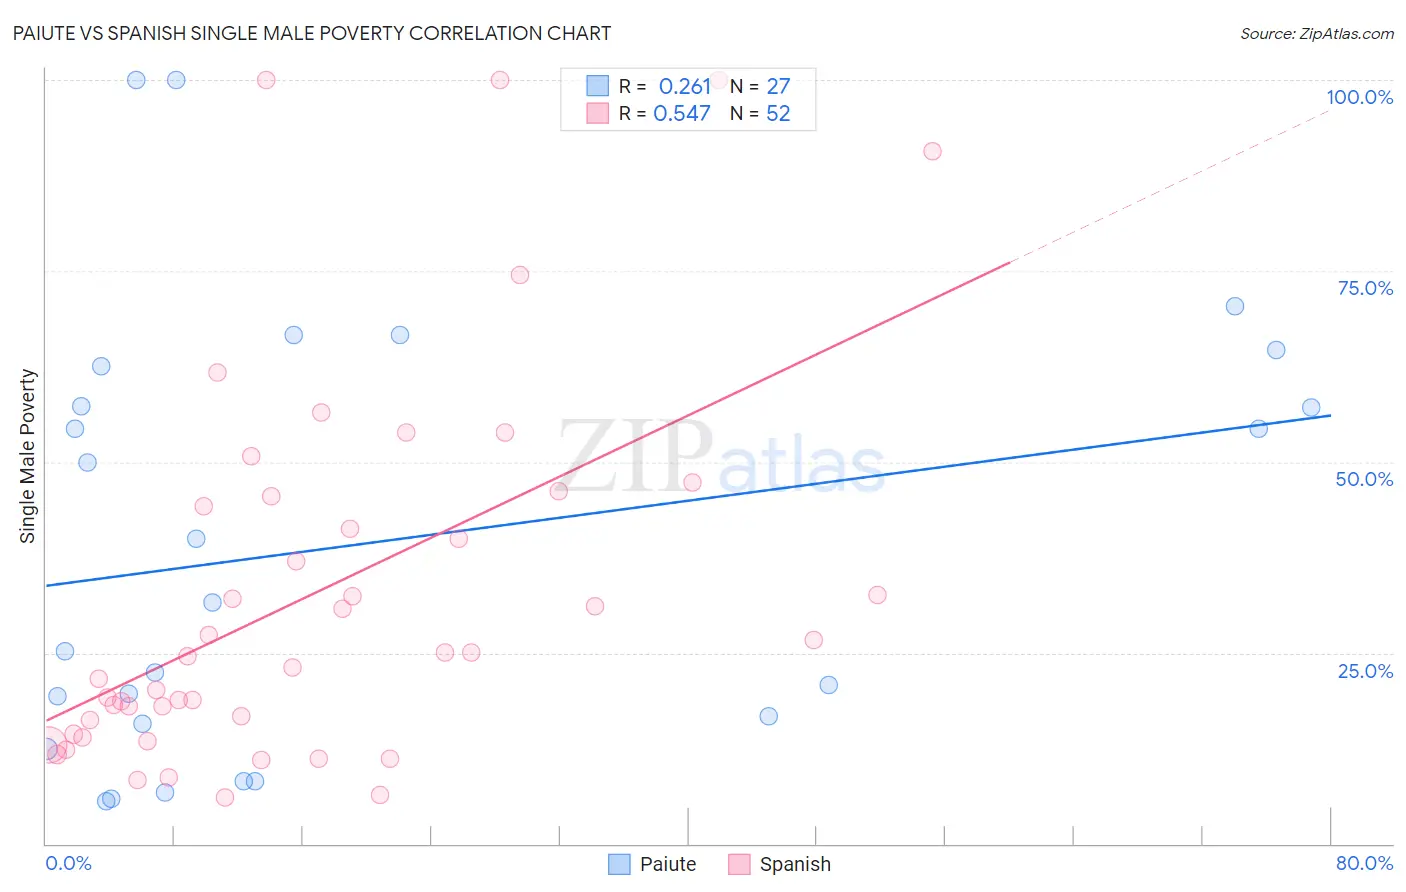
Paiute vs Spanish Single Male Poverty Correlation Chart
The statistical analysis conducted on geographies consisting of 56,714,476 people shows a weak positive correlation between the proportion of Paiute and poverty level among single males in the United States with a correlation coefficient (R) of 0.261 and weighted average of 19.3%. Similarly, the statistical analysis conducted on geographies consisting of 373,377,488 people shows a substantial positive correlation between the proportion of Spanish and poverty level among single males in the United States with a correlation coefficient (R) of 0.547 and weighted average of 13.6%, a difference of 42.1%.
Single Male Poverty Correlation Summary
| Measurement | Paiute | Spanish |
| Minimum | 5.6% | 6.1% |
| Maximum | 100.0% | 100.0% |
| Range | 94.4% | 93.9% |
| Mean | 39.3% | 32.7% |
| Median | 31.7% | 24.8% |
| Interquartile 25% (IQ1) | 15.8% | 15.3% |
| Interquartile 75% (IQ3) | 62.5% | 44.8% |
| Interquartile Range (IQR) | 46.7% | 29.6% |
| Standard Deviation (Sample) | 28.4% | 24.7% |
| Standard Deviation (Population) | 27.9% | 24.4% |
Similar Demographics by Single Male Poverty
Demographics Similar to Paiute by Single Male Poverty
In terms of single male poverty, the demographic groups most similar to Paiute are Cajun (19.1%, a difference of 1.1%), Native/Alaskan (19.6%, a difference of 1.7%), Inupiat (20.0%, a difference of 3.6%), Pima (20.2%, a difference of 4.4%), and Colville (18.4%, a difference of 4.6%).
| Demographics | Rating | Rank | Single Male Poverty |
| Immigrants | Yemen | 0.0 /100 | #324 | Tragic 16.9% |
| Choctaw | 0.0 /100 | #325 | Tragic 17.0% |
| Central American Indians | 0.0 /100 | #326 | Tragic 17.2% |
| Menominee | 0.0 /100 | #327 | Tragic 17.7% |
| Kiowa | 0.0 /100 | #328 | Tragic 18.3% |
| Colville | 0.0 /100 | #329 | Tragic 18.4% |
| Cajuns | 0.0 /100 | #330 | Tragic 19.1% |
| Paiute | 0.0 /100 | #331 | Tragic 19.3% |
| Natives/Alaskans | 0.0 /100 | #332 | Tragic 19.6% |
| Inupiat | 0.0 /100 | #333 | Tragic 20.0% |
| Pima | 0.0 /100 | #334 | Tragic 20.2% |
| Yuman | 0.0 /100 | #335 | Tragic 21.3% |
| Tohono O'odham | 0.0 /100 | #336 | Tragic 21.6% |
| Apache | 0.0 /100 | #337 | Tragic 21.6% |
| Pueblo | 0.0 /100 | #338 | Tragic 21.6% |
Demographics Similar to Spanish by Single Male Poverty
In terms of single male poverty, the demographic groups most similar to Spanish are Immigrants from Somalia (13.6%, a difference of 0.020%), Immigrants from Zaire (13.6%, a difference of 0.13%), Finnish (13.6%, a difference of 0.17%), Czech (13.5%, a difference of 0.24%), and Belgian (13.5%, a difference of 0.27%).
| Demographics | Rating | Rank | Single Male Poverty |
| Carpatho Rusyns | 2.1 /100 | #242 | Tragic 13.4% |
| Barbadians | 2.1 /100 | #243 | Tragic 13.4% |
| Immigrants | Senegal | 1.7 /100 | #244 | Tragic 13.5% |
| Immigrants | Latin America | 1.3 /100 | #245 | Tragic 13.5% |
| Immigrants | Micronesia | 1.2 /100 | #246 | Tragic 13.5% |
| Belgians | 1.2 /100 | #247 | Tragic 13.5% |
| Czechs | 1.2 /100 | #248 | Tragic 13.5% |
| Spanish | 1.0 /100 | #249 | Tragic 13.6% |
| Immigrants | Somalia | 1.0 /100 | #250 | Tragic 13.6% |
| Immigrants | Zaire | 0.9 /100 | #251 | Tragic 13.6% |
| Finns | 0.9 /100 | #252 | Tragic 13.6% |
| German Russians | 0.8 /100 | #253 | Tragic 13.6% |
| Sub-Saharan Africans | 0.5 /100 | #254 | Tragic 13.7% |
| Spaniards | 0.4 /100 | #255 | Tragic 13.7% |
| Immigrants | Belize | 0.4 /100 | #256 | Tragic 13.7% |