Alaskan Athabascan vs African Receiving Food Stamps
COMPARE
Alaskan Athabascan
African
Receiving Food Stamps
Receiving Food Stamps Comparison
Alaskan Athabascans
Africans
14.7%
RECEIVING FOOD STAMPS
0.1/ 100
METRIC RATING
273rd/ 347
METRIC RANK
15.1%
RECEIVING FOOD STAMPS
0.0/ 100
METRIC RATING
286th/ 347
METRIC RANK
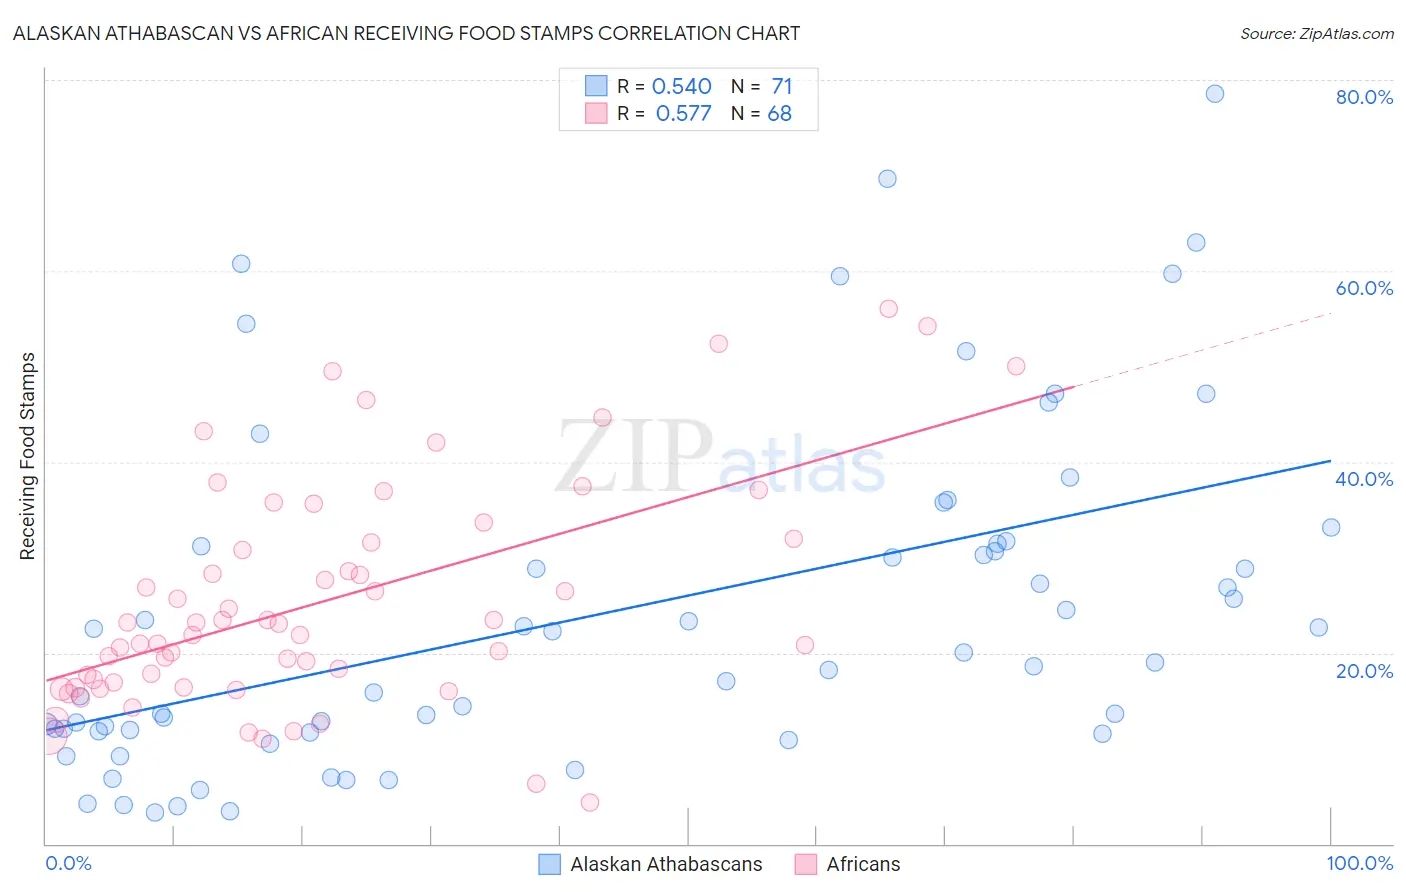
Alaskan Athabascan vs African Receiving Food Stamps Correlation Chart
The statistical analysis conducted on geographies consisting of 45,801,504 people shows a substantial positive correlation between the proportion of Alaskan Athabascans and percentage of population receiving government assistance and/or food stamps in the United States with a correlation coefficient (R) of 0.540 and weighted average of 14.7%. Similarly, the statistical analysis conducted on geographies consisting of 468,859,101 people shows a substantial positive correlation between the proportion of Africans and percentage of population receiving government assistance and/or food stamps in the United States with a correlation coefficient (R) of 0.577 and weighted average of 15.1%, a difference of 3.0%.
Receiving Food Stamps Correlation Summary
| Measurement | Alaskan Athabascan | African |
| Minimum | 3.3% | 4.3% |
| Maximum | 78.5% | 56.1% |
| Range | 75.2% | 51.8% |
| Mean | 24.2% | 25.4% |
| Median | 19.0% | 22.5% |
| Interquartile 25% (IQ1) | 11.8% | 16.6% |
| Interquartile 75% (IQ3) | 31.4% | 31.7% |
| Interquartile Range (IQR) | 19.6% | 15.1% |
| Standard Deviation (Sample) | 17.7% | 11.9% |
| Standard Deviation (Population) | 17.5% | 11.8% |
Demographics Similar to Alaskan Athabascans and Africans by Receiving Food Stamps
In terms of receiving food stamps, the demographic groups most similar to Alaskan Athabascans are Immigrants from Western Africa (14.7%, a difference of 0.020%), Chippewa (14.7%, a difference of 0.030%), Ute (14.7%, a difference of 0.10%), Immigrants from Guatemala (14.6%, a difference of 0.25%), and Mexican (14.6%, a difference of 0.35%). Similarly, the demographic groups most similar to Africans are Immigrants from Liberia (15.1%, a difference of 0.14%), Immigrants from Mexico (15.2%, a difference of 0.23%), Immigrants from Ecuador (15.0%, a difference of 0.52%), Bangladeshi (15.0%, a difference of 0.53%), and Immigrants from Belize (15.2%, a difference of 0.69%).
| Demographics | Rating | Rank | Receiving Food Stamps |
| Nepalese | 0.1 /100 | #269 | Tragic 14.6% |
| Mexicans | 0.1 /100 | #270 | Tragic 14.6% |
| Immigrants | Guatemala | 0.1 /100 | #271 | Tragic 14.6% |
| Chippewa | 0.1 /100 | #272 | Tragic 14.7% |
| Alaskan Athabascans | 0.1 /100 | #273 | Tragic 14.7% |
| Immigrants | Western Africa | 0.1 /100 | #274 | Tragic 14.7% |
| Ute | 0.1 /100 | #275 | Tragic 14.7% |
| Liberians | 0.1 /100 | #276 | Tragic 14.8% |
| Seminole | 0.1 /100 | #277 | Tragic 14.8% |
| Belizeans | 0.1 /100 | #278 | Tragic 14.8% |
| Kiowa | 0.0 /100 | #279 | Tragic 14.9% |
| Ecuadorians | 0.0 /100 | #280 | Tragic 14.9% |
| Spanish American Indians | 0.0 /100 | #281 | Tragic 14.9% |
| Immigrants | Central America | 0.0 /100 | #282 | Tragic 15.0% |
| Bangladeshis | 0.0 /100 | #283 | Tragic 15.0% |
| Immigrants | Ecuador | 0.0 /100 | #284 | Tragic 15.0% |
| Immigrants | Liberia | 0.0 /100 | #285 | Tragic 15.1% |
| Africans | 0.0 /100 | #286 | Tragic 15.1% |
| Immigrants | Mexico | 0.0 /100 | #287 | Tragic 15.2% |
| Immigrants | Belize | 0.0 /100 | #288 | Tragic 15.2% |
| Immigrants | Senegal | 0.0 /100 | #289 | Tragic 15.3% |