Immigrants from Western Africa vs Immigrants from Peru Male Poverty
COMPARE
Immigrants from Western Africa
Immigrants from Peru
Male Poverty
Male Poverty Comparison
Immigrants from Western Africa
Immigrants from Peru
12.9%
MALE POVERTY
0.2/ 100
METRIC RATING
247th/ 347
METRIC RANK
10.7%
MALE POVERTY
84.1/ 100
METRIC RATING
129th/ 347
METRIC RANK
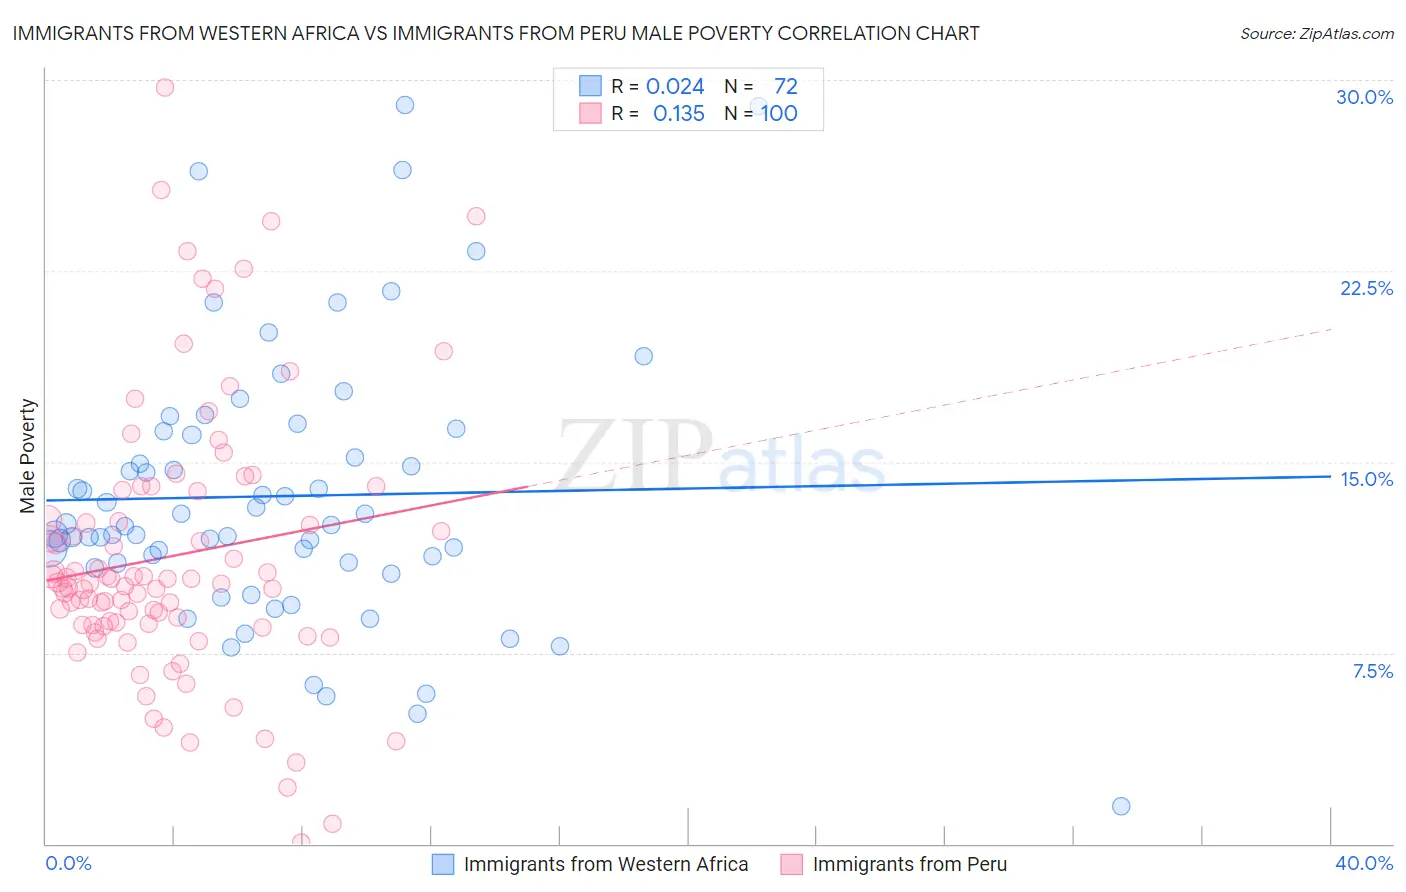
Immigrants from Western Africa vs Immigrants from Peru Male Poverty Correlation Chart
The statistical analysis conducted on geographies consisting of 357,450,071 people shows no correlation between the proportion of Immigrants from Western Africa and poverty level among males in the United States with a correlation coefficient (R) of 0.024 and weighted average of 12.9%. Similarly, the statistical analysis conducted on geographies consisting of 328,672,815 people shows a poor positive correlation between the proportion of Immigrants from Peru and poverty level among males in the United States with a correlation coefficient (R) of 0.135 and weighted average of 10.7%, a difference of 20.1%.
Male Poverty Correlation Summary
| Measurement | Immigrants from Western Africa | Immigrants from Peru |
| Minimum | 1.4% | 0.066% |
| Maximum | 29.0% | 29.7% |
| Range | 27.6% | 29.6% |
| Mean | 13.7% | 11.3% |
| Median | 12.5% | 10.2% |
| Interquartile 25% (IQ1) | 11.0% | 8.6% |
| Interquartile 75% (IQ3) | 16.1% | 13.3% |
| Interquartile Range (IQR) | 5.1% | 4.7% |
| Standard Deviation (Sample) | 5.3% | 5.3% |
| Standard Deviation (Population) | 5.3% | 5.3% |
Similar Demographics by Male Poverty
Demographics Similar to Immigrants from Western Africa by Male Poverty
In terms of male poverty, the demographic groups most similar to Immigrants from Western Africa are Immigrants from Sudan (12.9%, a difference of 0.060%), Potawatomi (12.9%, a difference of 0.13%), Immigrants from Nicaragua (12.9%, a difference of 0.14%), Immigrants from Cuba (12.9%, a difference of 0.24%), and Immigrants from Ecuador (12.9%, a difference of 0.27%).
| Demographics | Rating | Rank | Male Poverty |
| Immigrants | Middle Africa | 0.4 /100 | #240 | Tragic 12.7% |
| Sudanese | 0.3 /100 | #241 | Tragic 12.8% |
| Nepalese | 0.3 /100 | #242 | Tragic 12.8% |
| Alaskan Athabascans | 0.3 /100 | #243 | Tragic 12.8% |
| Tsimshian | 0.3 /100 | #244 | Tragic 12.8% |
| Liberians | 0.3 /100 | #245 | Tragic 12.8% |
| Immigrants | El Salvador | 0.2 /100 | #246 | Tragic 12.8% |
| Immigrants | Western Africa | 0.2 /100 | #247 | Tragic 12.9% |
| Immigrants | Sudan | 0.2 /100 | #248 | Tragic 12.9% |
| Potawatomi | 0.2 /100 | #249 | Tragic 12.9% |
| Immigrants | Nicaragua | 0.2 /100 | #250 | Tragic 12.9% |
| Immigrants | Cuba | 0.2 /100 | #251 | Tragic 12.9% |
| Immigrants | Ecuador | 0.2 /100 | #252 | Tragic 12.9% |
| Immigrants | Ghana | 0.2 /100 | #253 | Tragic 12.9% |
| Mexican American Indians | 0.1 /100 | #254 | Tragic 13.0% |
Demographics Similar to Immigrants from Peru by Male Poverty
In terms of male poverty, the demographic groups most similar to Immigrants from Peru are Immigrants from Western Europe (10.7%, a difference of 0.010%), Immigrants from Ukraine (10.7%, a difference of 0.030%), Puget Sound Salish (10.7%, a difference of 0.030%), Chilean (10.7%, a difference of 0.050%), and Immigrants from Belarus (10.7%, a difference of 0.15%).
| Demographics | Rating | Rank | Male Poverty |
| Native Hawaiians | 87.0 /100 | #122 | Excellent 10.7% |
| South Africans | 86.8 /100 | #123 | Excellent 10.7% |
| French | 86.7 /100 | #124 | Excellent 10.7% |
| Immigrants | Norway | 86.0 /100 | #125 | Excellent 10.7% |
| Immigrants | Ukraine | 84.3 /100 | #126 | Excellent 10.7% |
| Puget Sound Salish | 84.3 /100 | #127 | Excellent 10.7% |
| Immigrants | Western Europe | 84.2 /100 | #128 | Excellent 10.7% |
| Immigrants | Peru | 84.1 /100 | #129 | Excellent 10.7% |
| Chileans | 83.9 /100 | #130 | Excellent 10.7% |
| Immigrants | Belarus | 83.3 /100 | #131 | Excellent 10.7% |
| Immigrants | Vietnam | 83.0 /100 | #132 | Excellent 10.8% |
| Pakistanis | 83.0 /100 | #133 | Excellent 10.8% |
| New Zealanders | 82.9 /100 | #134 | Excellent 10.8% |
| Brazilians | 82.7 /100 | #135 | Excellent 10.8% |
| Immigrants | Israel | 80.9 /100 | #136 | Excellent 10.8% |