Sri Lankan vs Immigrants from Peru Male Poverty
COMPARE
Sri Lankan
Immigrants from Peru
Male Poverty
Male Poverty Comparison
Sri Lankans
Immigrants from Peru
10.6%
MALE POVERTY
88.1/ 100
METRIC RATING
116th/ 347
METRIC RANK
10.7%
MALE POVERTY
84.1/ 100
METRIC RATING
129th/ 347
METRIC RANK
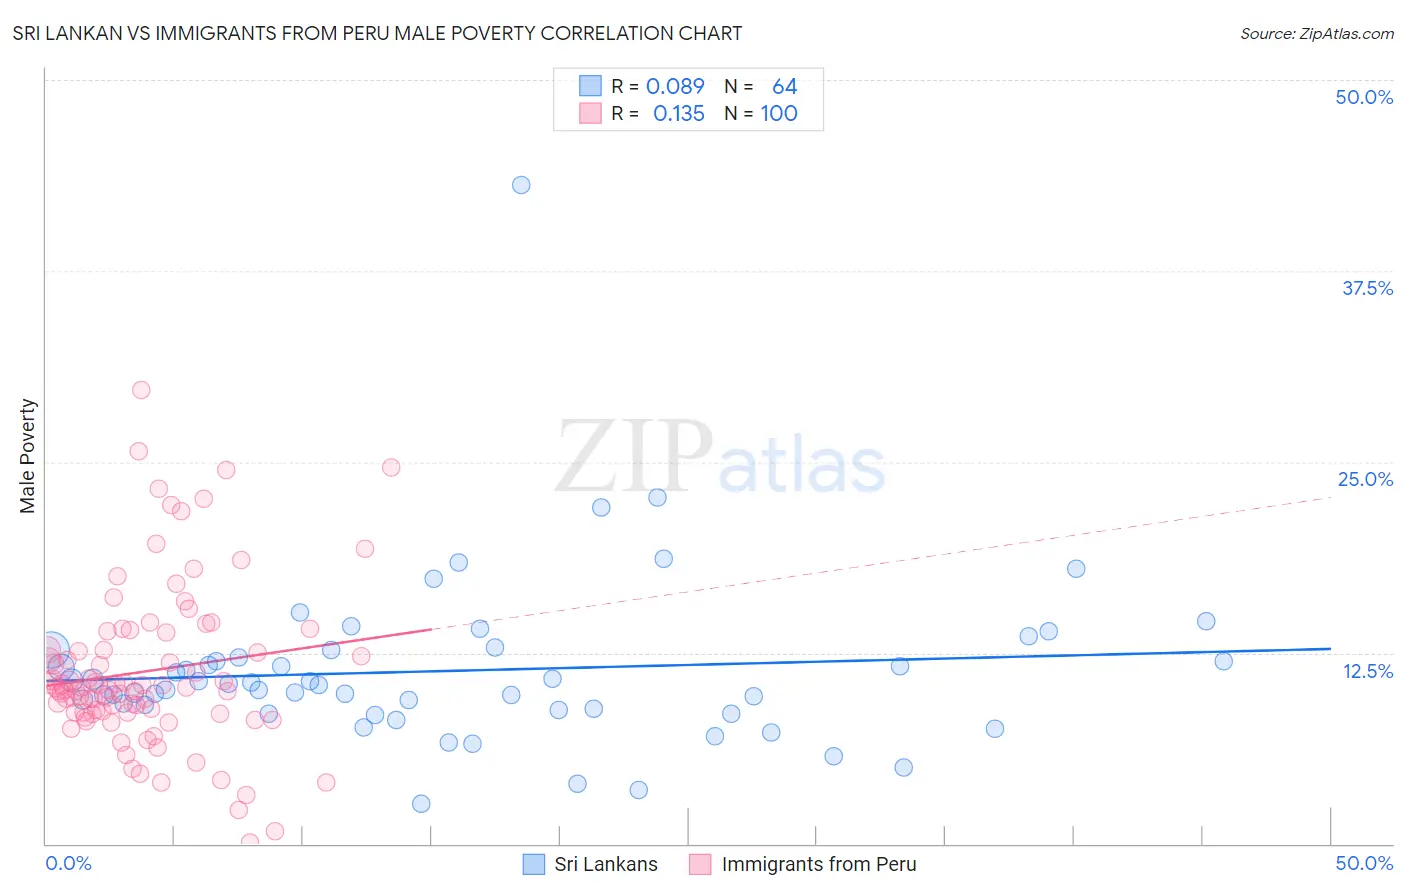
Sri Lankan vs Immigrants from Peru Male Poverty Correlation Chart
The statistical analysis conducted on geographies consisting of 439,980,227 people shows a slight positive correlation between the proportion of Sri Lankans and poverty level among males in the United States with a correlation coefficient (R) of 0.089 and weighted average of 10.6%. Similarly, the statistical analysis conducted on geographies consisting of 328,672,815 people shows a poor positive correlation between the proportion of Immigrants from Peru and poverty level among males in the United States with a correlation coefficient (R) of 0.135 and weighted average of 10.7%, a difference of 0.86%.
Male Poverty Correlation Summary
| Measurement | Sri Lankan | Immigrants from Peru |
| Minimum | 2.6% | 0.066% |
| Maximum | 43.1% | 29.7% |
| Range | 40.5% | 29.6% |
| Mean | 11.3% | 11.3% |
| Median | 10.4% | 10.2% |
| Interquartile 25% (IQ1) | 8.8% | 8.6% |
| Interquartile 75% (IQ3) | 12.4% | 13.3% |
| Interquartile Range (IQR) | 3.6% | 4.7% |
| Standard Deviation (Sample) | 5.6% | 5.3% |
| Standard Deviation (Population) | 5.5% | 5.3% |
Demographics Similar to Sri Lankans and Immigrants from Peru by Male Poverty
In terms of male poverty, the demographic groups most similar to Sri Lankans are Immigrants from South Eastern Asia (10.6%, a difference of 0.010%), Immigrants from Russia (10.6%, a difference of 0.11%), Okinawan (10.7%, a difference of 0.12%), Immigrants from Hungary (10.7%, a difference of 0.13%), and Immigrants from Brazil (10.6%, a difference of 0.23%). Similarly, the demographic groups most similar to Immigrants from Peru are Immigrants from Western Europe (10.7%, a difference of 0.010%), Immigrants from Ukraine (10.7%, a difference of 0.030%), Puget Sound Salish (10.7%, a difference of 0.030%), Chilean (10.7%, a difference of 0.050%), and Immigrants from Belarus (10.7%, a difference of 0.15%).
| Demographics | Rating | Rank | Male Poverty |
| Immigrants | Turkey | 89.5 /100 | #112 | Excellent 10.6% |
| Palestinians | 89.1 /100 | #113 | Excellent 10.6% |
| Immigrants | Brazil | 89.0 /100 | #114 | Excellent 10.6% |
| Immigrants | Russia | 88.6 /100 | #115 | Excellent 10.6% |
| Sri Lankans | 88.1 /100 | #116 | Excellent 10.6% |
| Immigrants | South Eastern Asia | 88.1 /100 | #117 | Excellent 10.6% |
| Okinawans | 87.6 /100 | #118 | Excellent 10.7% |
| Immigrants | Hungary | 87.6 /100 | #119 | Excellent 10.7% |
| Immigrants | China | 87.1 /100 | #120 | Excellent 10.7% |
| Peruvians | 87.1 /100 | #121 | Excellent 10.7% |
| Native Hawaiians | 87.0 /100 | #122 | Excellent 10.7% |
| South Africans | 86.8 /100 | #123 | Excellent 10.7% |
| French | 86.7 /100 | #124 | Excellent 10.7% |
| Immigrants | Norway | 86.0 /100 | #125 | Excellent 10.7% |
| Immigrants | Ukraine | 84.3 /100 | #126 | Excellent 10.7% |
| Puget Sound Salish | 84.3 /100 | #127 | Excellent 10.7% |
| Immigrants | Western Europe | 84.2 /100 | #128 | Excellent 10.7% |
| Immigrants | Peru | 84.1 /100 | #129 | Excellent 10.7% |
| Chileans | 83.9 /100 | #130 | Excellent 10.7% |
| Immigrants | Belarus | 83.3 /100 | #131 | Excellent 10.7% |
| Immigrants | Vietnam | 83.0 /100 | #132 | Excellent 10.8% |