Immigrants from Asia vs Immigrants from Peru Male Poverty
COMPARE
Immigrants from Asia
Immigrants from Peru
Male Poverty
Male Poverty Comparison
Immigrants from Asia
Immigrants from Peru
10.2%
MALE POVERTY
97.0/ 100
METRIC RATING
73rd/ 347
METRIC RANK
10.7%
MALE POVERTY
84.1/ 100
METRIC RATING
129th/ 347
METRIC RANK
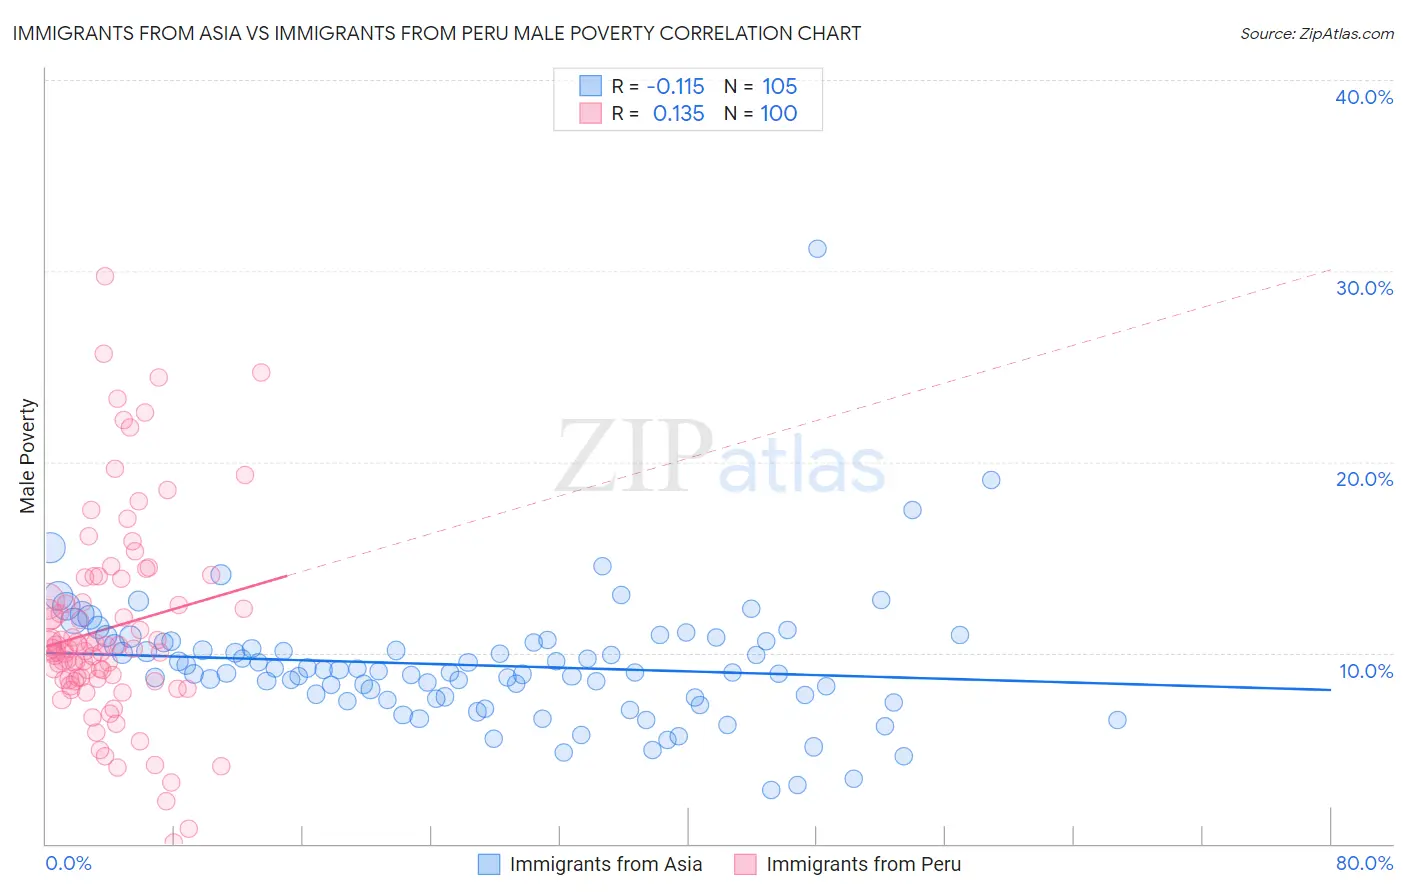
Immigrants from Asia vs Immigrants from Peru Male Poverty Correlation Chart
The statistical analysis conducted on geographies consisting of 547,932,841 people shows a poor negative correlation between the proportion of Immigrants from Asia and poverty level among males in the United States with a correlation coefficient (R) of -0.115 and weighted average of 10.2%. Similarly, the statistical analysis conducted on geographies consisting of 328,672,815 people shows a poor positive correlation between the proportion of Immigrants from Peru and poverty level among males in the United States with a correlation coefficient (R) of 0.135 and weighted average of 10.7%, a difference of 4.8%.
Male Poverty Correlation Summary
| Measurement | Immigrants from Asia | Immigrants from Peru |
| Minimum | 2.8% | 0.066% |
| Maximum | 31.2% | 29.7% |
| Range | 28.3% | 29.6% |
| Mean | 9.3% | 11.3% |
| Median | 9.0% | 10.2% |
| Interquartile 25% (IQ1) | 7.6% | 8.6% |
| Interquartile 75% (IQ3) | 10.6% | 13.3% |
| Interquartile Range (IQR) | 3.0% | 4.7% |
| Standard Deviation (Sample) | 3.4% | 5.3% |
| Standard Deviation (Population) | 3.4% | 5.3% |
Similar Demographics by Male Poverty
Demographics Similar to Immigrants from Asia by Male Poverty
In terms of male poverty, the demographic groups most similar to Immigrants from Asia are Immigrants from Eastern Europe (10.2%, a difference of 0.070%), Immigrants from Canada (10.2%, a difference of 0.080%), Carpatho Rusyn (10.2%, a difference of 0.080%), Dutch (10.2%, a difference of 0.080%), and European (10.2%, a difference of 0.090%).
| Demographics | Rating | Rank | Male Poverty |
| Serbians | 97.5 /100 | #66 | Exceptional 10.2% |
| Immigrants | Netherlands | 97.3 /100 | #67 | Exceptional 10.2% |
| Immigrants | Sri Lanka | 97.2 /100 | #68 | Exceptional 10.2% |
| Immigrants | Australia | 97.1 /100 | #69 | Exceptional 10.2% |
| Paraguayans | 97.1 /100 | #70 | Exceptional 10.2% |
| Europeans | 97.1 /100 | #71 | Exceptional 10.2% |
| Immigrants | Canada | 97.1 /100 | #72 | Exceptional 10.2% |
| Immigrants | Asia | 97.0 /100 | #73 | Exceptional 10.2% |
| Immigrants | Eastern Europe | 96.9 /100 | #74 | Exceptional 10.2% |
| Carpatho Rusyns | 96.9 /100 | #75 | Exceptional 10.2% |
| Dutch | 96.9 /100 | #76 | Exceptional 10.2% |
| Immigrants | Belgium | 96.8 /100 | #77 | Exceptional 10.3% |
| Irish | 96.8 /100 | #78 | Exceptional 10.3% |
| Immigrants | North America | 96.5 /100 | #79 | Exceptional 10.3% |
| English | 96.4 /100 | #80 | Exceptional 10.3% |
Demographics Similar to Immigrants from Peru by Male Poverty
In terms of male poverty, the demographic groups most similar to Immigrants from Peru are Immigrants from Western Europe (10.7%, a difference of 0.010%), Immigrants from Ukraine (10.7%, a difference of 0.030%), Puget Sound Salish (10.7%, a difference of 0.030%), Chilean (10.7%, a difference of 0.050%), and Immigrants from Belarus (10.7%, a difference of 0.15%).
| Demographics | Rating | Rank | Male Poverty |
| Native Hawaiians | 87.0 /100 | #122 | Excellent 10.7% |
| South Africans | 86.8 /100 | #123 | Excellent 10.7% |
| French | 86.7 /100 | #124 | Excellent 10.7% |
| Immigrants | Norway | 86.0 /100 | #125 | Excellent 10.7% |
| Immigrants | Ukraine | 84.3 /100 | #126 | Excellent 10.7% |
| Puget Sound Salish | 84.3 /100 | #127 | Excellent 10.7% |
| Immigrants | Western Europe | 84.2 /100 | #128 | Excellent 10.7% |
| Immigrants | Peru | 84.1 /100 | #129 | Excellent 10.7% |
| Chileans | 83.9 /100 | #130 | Excellent 10.7% |
| Immigrants | Belarus | 83.3 /100 | #131 | Excellent 10.7% |
| Immigrants | Vietnam | 83.0 /100 | #132 | Excellent 10.8% |
| Pakistanis | 83.0 /100 | #133 | Excellent 10.8% |
| New Zealanders | 82.9 /100 | #134 | Excellent 10.8% |
| Brazilians | 82.7 /100 | #135 | Excellent 10.8% |
| Immigrants | Israel | 80.9 /100 | #136 | Excellent 10.8% |