Osage vs Immigrants from Greece Householder Income Ages 45 - 64 years
COMPARE
Osage
Immigrants from Greece
Householder Income Ages 45 - 64 years
Householder Income Ages 45 - 64 years Comparison
Osage
Immigrants from Greece
$88,390
HOUSEHOLDER INCOME AGES 45 - 64 YEARS
0.3/ 100
METRIC RATING
264th/ 347
METRIC RANK
$113,548
HOUSEHOLDER INCOME AGES 45 - 64 YEARS
99.9/ 100
METRIC RATING
46th/ 347
METRIC RANK
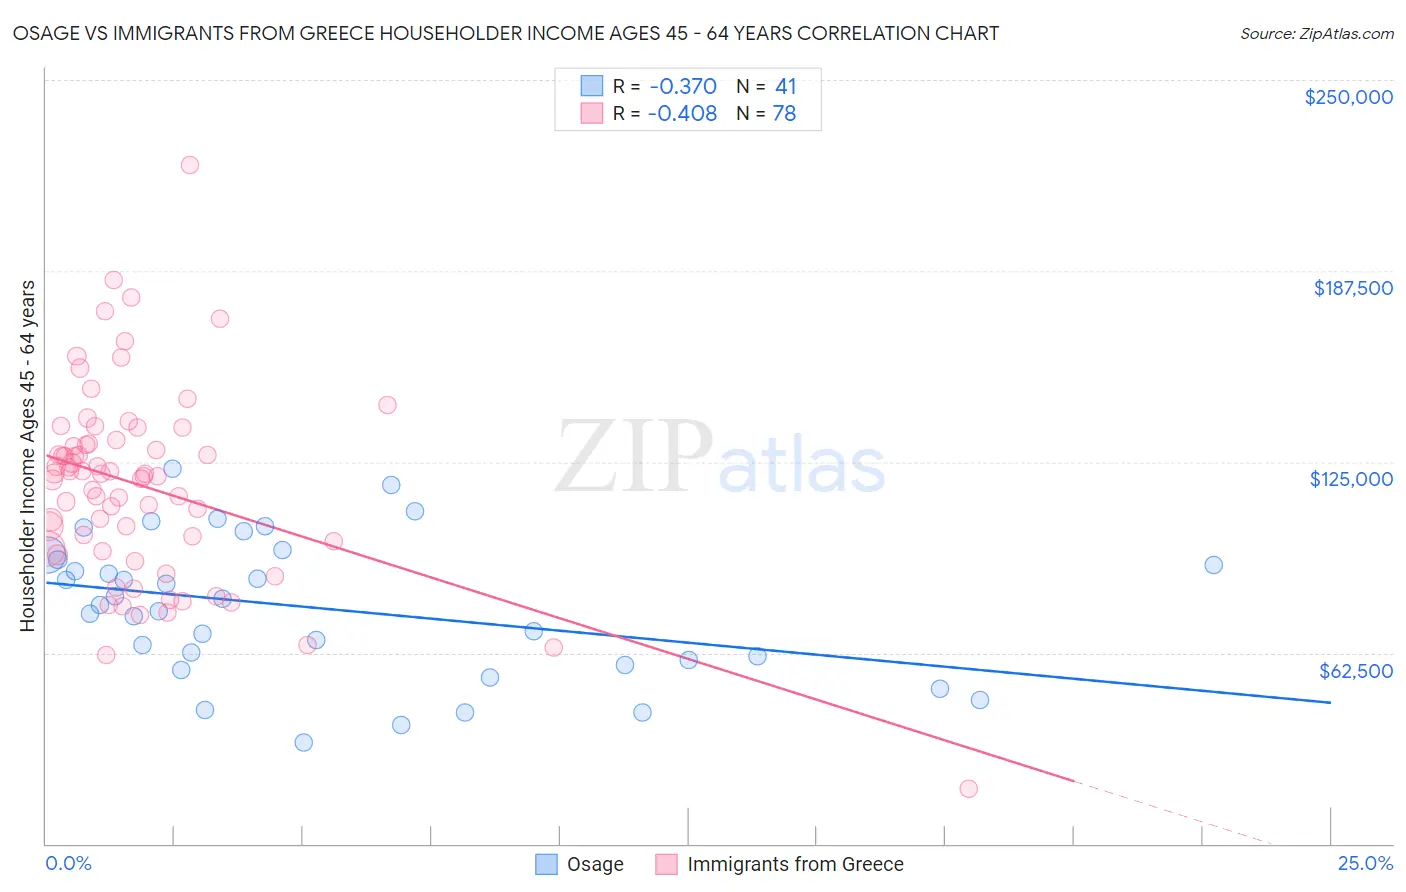
Osage vs Immigrants from Greece Householder Income Ages 45 - 64 years Correlation Chart
The statistical analysis conducted on geographies consisting of 91,774,888 people shows a mild negative correlation between the proportion of Osage and household income with householder between the ages 45 and 64 in the United States with a correlation coefficient (R) of -0.370 and weighted average of $88,390. Similarly, the statistical analysis conducted on geographies consisting of 216,803,825 people shows a moderate negative correlation between the proportion of Immigrants from Greece and household income with householder between the ages 45 and 64 in the United States with a correlation coefficient (R) of -0.408 and weighted average of $113,548, a difference of 28.5%.
Householder Income Ages 45 - 64 years Correlation Summary
| Measurement | Osage | Immigrants from Greece |
| Minimum | $33,125 | $18,083 |
| Maximum | $122,824 | $222,000 |
| Range | $89,699 | $203,917 |
| Mean | $76,991 | $117,037 |
| Median | $78,120 | $120,719 |
| Interquartile 25% (IQ1) | $59,314 | $96,498 |
| Interquartile 75% (IQ3) | $93,781 | $131,127 |
| Interquartile Range (IQR) | $34,467 | $34,629 |
| Standard Deviation (Sample) | $22,918 | $31,775 |
| Standard Deviation (Population) | $22,637 | $31,571 |
Similar Demographics by Householder Income Ages 45 - 64 years
Demographics Similar to Osage by Householder Income Ages 45 - 64 years
In terms of householder income ages 45 - 64 years, the demographic groups most similar to Osage are Immigrants from Senegal ($88,421, a difference of 0.040%), Jamaican ($88,327, a difference of 0.070%), Somali ($88,600, a difference of 0.24%), Immigrants from West Indies ($88,164, a difference of 0.26%), and Hmong ($88,115, a difference of 0.31%).
| Demographics | Rating | Rank | Householder Income Ages 45 - 64 years |
| German Russians | 0.4 /100 | #257 | Tragic $89,398 |
| Immigrants | Barbados | 0.4 /100 | #258 | Tragic $89,394 |
| Immigrants | Nicaragua | 0.4 /100 | #259 | Tragic $89,108 |
| Liberians | 0.3 /100 | #260 | Tragic $88,929 |
| Belizeans | 0.3 /100 | #261 | Tragic $88,684 |
| Somalis | 0.3 /100 | #262 | Tragic $88,600 |
| Immigrants | Senegal | 0.3 /100 | #263 | Tragic $88,421 |
| Osage | 0.3 /100 | #264 | Tragic $88,390 |
| Jamaicans | 0.2 /100 | #265 | Tragic $88,327 |
| Immigrants | West Indies | 0.2 /100 | #266 | Tragic $88,164 |
| Hmong | 0.2 /100 | #267 | Tragic $88,115 |
| Immigrants | Micronesia | 0.2 /100 | #268 | Tragic $87,864 |
| Spanish Americans | 0.2 /100 | #269 | Tragic $87,836 |
| Immigrants | Liberia | 0.2 /100 | #270 | Tragic $87,739 |
| Guatemalans | 0.2 /100 | #271 | Tragic $87,705 |
Demographics Similar to Immigrants from Greece by Householder Income Ages 45 - 64 years
In terms of householder income ages 45 - 64 years, the demographic groups most similar to Immigrants from Greece are Australian ($113,533, a difference of 0.010%), Immigrants from Indonesia ($113,519, a difference of 0.030%), Immigrants from France ($113,680, a difference of 0.12%), Bulgarian ($113,883, a difference of 0.29%), and Immigrants from Russia ($113,215, a difference of 0.29%).
| Demographics | Rating | Rank | Householder Income Ages 45 - 64 years |
| Immigrants | Turkey | 99.9 /100 | #39 | Exceptional $114,407 |
| Cambodians | 99.9 /100 | #40 | Exceptional $114,342 |
| Immigrants | Lithuania | 99.9 /100 | #41 | Exceptional $114,336 |
| Estonians | 99.9 /100 | #42 | Exceptional $114,220 |
| Israelis | 99.9 /100 | #43 | Exceptional $114,186 |
| Bulgarians | 99.9 /100 | #44 | Exceptional $113,883 |
| Immigrants | France | 99.9 /100 | #45 | Exceptional $113,680 |
| Immigrants | Greece | 99.9 /100 | #46 | Exceptional $113,548 |
| Australians | 99.9 /100 | #47 | Exceptional $113,533 |
| Immigrants | Indonesia | 99.9 /100 | #48 | Exceptional $113,519 |
| Immigrants | Russia | 99.8 /100 | #49 | Exceptional $113,215 |
| Immigrants | Austria | 99.8 /100 | #50 | Exceptional $113,140 |
| Immigrants | South Africa | 99.8 /100 | #51 | Exceptional $112,886 |
| Immigrants | Malaysia | 99.8 /100 | #52 | Exceptional $112,796 |
| Afghans | 99.8 /100 | #53 | Exceptional $112,676 |