Osage vs Immigrants from Bosnia and Herzegovina Single Mother Poverty
COMPARE
Osage
Immigrants from Bosnia and Herzegovina
Single Mother Poverty
Single Mother Poverty Comparison
Osage
Immigrants from Bosnia and Herzegovina
32.6%
SINGLE MOTHER POVERTY
0.0/ 100
METRIC RATING
290th/ 347
METRIC RANK
29.2%
SINGLE MOTHER POVERTY
45.1/ 100
METRIC RATING
177th/ 347
METRIC RANK
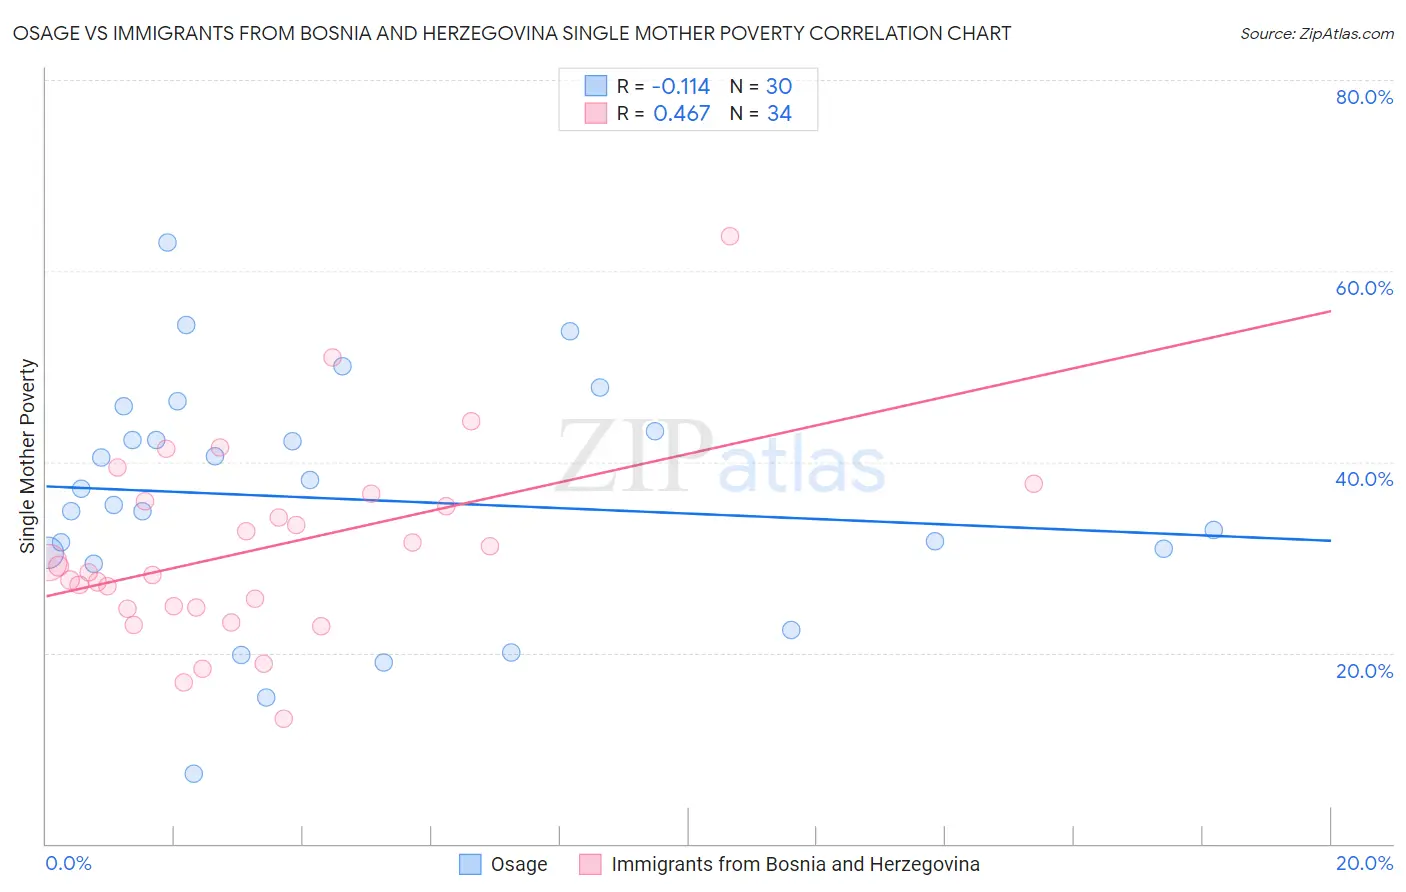
Osage vs Immigrants from Bosnia and Herzegovina Single Mother Poverty Correlation Chart
The statistical analysis conducted on geographies consisting of 91,278,807 people shows a poor negative correlation between the proportion of Osage and poverty level among single mothers in the United States with a correlation coefficient (R) of -0.114 and weighted average of 32.6%. Similarly, the statistical analysis conducted on geographies consisting of 155,194,459 people shows a moderate positive correlation between the proportion of Immigrants from Bosnia and Herzegovina and poverty level among single mothers in the United States with a correlation coefficient (R) of 0.467 and weighted average of 29.2%, a difference of 11.6%.
Single Mother Poverty Correlation Summary
| Measurement | Osage | Immigrants from Bosnia and Herzegovina |
| Minimum | 7.3% | 13.0% |
| Maximum | 63.0% | 63.6% |
| Range | 55.7% | 50.6% |
| Mean | 36.1% | 30.9% |
| Median | 36.3% | 28.8% |
| Interquartile 25% (IQ1) | 30.5% | 24.7% |
| Interquartile 75% (IQ3) | 43.2% | 35.9% |
| Interquartile Range (IQR) | 12.7% | 11.2% |
| Standard Deviation (Sample) | 12.5% | 10.0% |
| Standard Deviation (Population) | 12.3% | 9.9% |
Similar Demographics by Single Mother Poverty
Demographics Similar to Osage by Single Mother Poverty
In terms of single mother poverty, the demographic groups most similar to Osage are U.S. Virgin Islander (32.6%, a difference of 0.11%), Somali (32.6%, a difference of 0.14%), Immigrants from Dominica (32.5%, a difference of 0.37%), Yup'ik (32.5%, a difference of 0.49%), and Immigrants from Latin America (32.4%, a difference of 0.57%).
| Demographics | Rating | Rank | Single Mother Poverty |
| Spanish Americans | 0.0 /100 | #283 | Tragic 32.3% |
| Indonesians | 0.0 /100 | #284 | Tragic 32.4% |
| Immigrants | Latin America | 0.0 /100 | #285 | Tragic 32.4% |
| Yup'ik | 0.0 /100 | #286 | Tragic 32.5% |
| Immigrants | Dominica | 0.0 /100 | #287 | Tragic 32.5% |
| Somalis | 0.0 /100 | #288 | Tragic 32.6% |
| U.S. Virgin Islanders | 0.0 /100 | #289 | Tragic 32.6% |
| Osage | 0.0 /100 | #290 | Tragic 32.6% |
| Guatemalans | 0.0 /100 | #291 | Tragic 32.9% |
| Shoshone | 0.0 /100 | #292 | Tragic 32.9% |
| Aleuts | 0.0 /100 | #293 | Tragic 32.9% |
| French American Indians | 0.0 /100 | #294 | Tragic 33.1% |
| Yaqui | 0.0 /100 | #295 | Tragic 33.1% |
| Blackfeet | 0.0 /100 | #296 | Tragic 33.2% |
| Pennsylvania Germans | 0.0 /100 | #297 | Tragic 33.2% |
Demographics Similar to Immigrants from Bosnia and Herzegovina by Single Mother Poverty
In terms of single mother poverty, the demographic groups most similar to Immigrants from Bosnia and Herzegovina are South American Indian (29.3%, a difference of 0.090%), Immigrants from Uzbekistan (29.3%, a difference of 0.12%), Hawaiian (29.2%, a difference of 0.13%), Immigrants from Costa Rica (29.2%, a difference of 0.17%), and Immigrants from Norway (29.3%, a difference of 0.18%).
| Demographics | Rating | Rank | Single Mother Poverty |
| New Zealanders | 55.1 /100 | #170 | Average 29.1% |
| Puget Sound Salish | 55.1 /100 | #171 | Average 29.1% |
| Carpatho Rusyns | 53.8 /100 | #172 | Average 29.1% |
| British | 50.6 /100 | #173 | Average 29.2% |
| Immigrants | Saudi Arabia | 50.0 /100 | #174 | Average 29.2% |
| Immigrants | Costa Rica | 48.8 /100 | #175 | Average 29.2% |
| Hawaiians | 47.8 /100 | #176 | Average 29.2% |
| Immigrants | Bosnia and Herzegovina | 45.1 /100 | #177 | Average 29.2% |
| South American Indians | 43.2 /100 | #178 | Average 29.3% |
| Immigrants | Uzbekistan | 42.6 /100 | #179 | Average 29.3% |
| Immigrants | Norway | 41.5 /100 | #180 | Average 29.3% |
| Canadians | 40.4 /100 | #181 | Average 29.3% |
| Immigrants | Eastern Africa | 38.5 /100 | #182 | Fair 29.3% |
| Nepalese | 38.3 /100 | #183 | Fair 29.3% |
| Nigerians | 38.0 /100 | #184 | Fair 29.3% |