Osage vs Immigrants from Egypt Single Mother Poverty
COMPARE
Osage
Immigrants from Egypt
Single Mother Poverty
Single Mother Poverty Comparison
Osage
Immigrants from Egypt
32.6%
SINGLE MOTHER POVERTY
0.0/ 100
METRIC RATING
290th/ 347
METRIC RANK
27.1%
SINGLE MOTHER POVERTY
99.7/ 100
METRIC RATING
55th/ 347
METRIC RANK
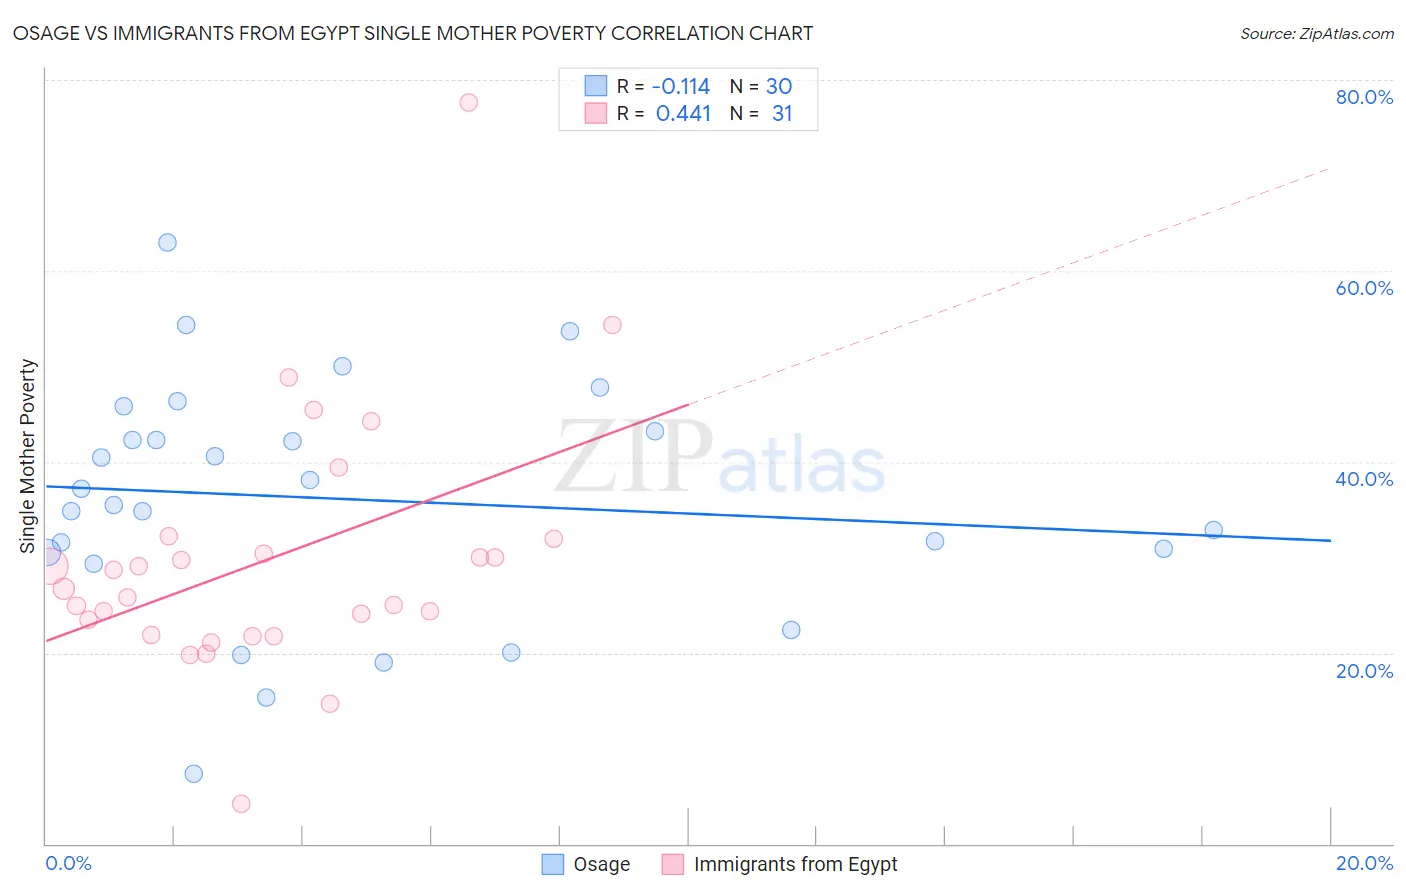
Osage vs Immigrants from Egypt Single Mother Poverty Correlation Chart
The statistical analysis conducted on geographies consisting of 91,278,807 people shows a poor negative correlation between the proportion of Osage and poverty level among single mothers in the United States with a correlation coefficient (R) of -0.114 and weighted average of 32.6%. Similarly, the statistical analysis conducted on geographies consisting of 241,181,927 people shows a moderate positive correlation between the proportion of Immigrants from Egypt and poverty level among single mothers in the United States with a correlation coefficient (R) of 0.441 and weighted average of 27.1%, a difference of 20.2%.
Single Mother Poverty Correlation Summary
| Measurement | Osage | Immigrants from Egypt |
| Minimum | 7.3% | 4.2% |
| Maximum | 63.0% | 77.6% |
| Range | 55.7% | 73.4% |
| Mean | 36.1% | 29.8% |
| Median | 36.3% | 26.7% |
| Interquartile 25% (IQ1) | 30.5% | 21.9% |
| Interquartile 75% (IQ3) | 43.2% | 31.9% |
| Interquartile Range (IQR) | 12.7% | 10.1% |
| Standard Deviation (Sample) | 12.5% | 13.4% |
| Standard Deviation (Population) | 12.3% | 13.2% |
Similar Demographics by Single Mother Poverty
Demographics Similar to Osage by Single Mother Poverty
In terms of single mother poverty, the demographic groups most similar to Osage are U.S. Virgin Islander (32.6%, a difference of 0.11%), Somali (32.6%, a difference of 0.14%), Immigrants from Dominica (32.5%, a difference of 0.37%), Yup'ik (32.5%, a difference of 0.49%), and Immigrants from Latin America (32.4%, a difference of 0.57%).
| Demographics | Rating | Rank | Single Mother Poverty |
| Spanish Americans | 0.0 /100 | #283 | Tragic 32.3% |
| Indonesians | 0.0 /100 | #284 | Tragic 32.4% |
| Immigrants | Latin America | 0.0 /100 | #285 | Tragic 32.4% |
| Yup'ik | 0.0 /100 | #286 | Tragic 32.5% |
| Immigrants | Dominica | 0.0 /100 | #287 | Tragic 32.5% |
| Somalis | 0.0 /100 | #288 | Tragic 32.6% |
| U.S. Virgin Islanders | 0.0 /100 | #289 | Tragic 32.6% |
| Osage | 0.0 /100 | #290 | Tragic 32.6% |
| Guatemalans | 0.0 /100 | #291 | Tragic 32.9% |
| Shoshone | 0.0 /100 | #292 | Tragic 32.9% |
| Aleuts | 0.0 /100 | #293 | Tragic 32.9% |
| French American Indians | 0.0 /100 | #294 | Tragic 33.1% |
| Yaqui | 0.0 /100 | #295 | Tragic 33.1% |
| Blackfeet | 0.0 /100 | #296 | Tragic 33.2% |
| Pennsylvania Germans | 0.0 /100 | #297 | Tragic 33.2% |
Demographics Similar to Immigrants from Egypt by Single Mother Poverty
In terms of single mother poverty, the demographic groups most similar to Immigrants from Egypt are Immigrants from Bulgaria (27.1%, a difference of 0.030%), Immigrants from Romania (27.2%, a difference of 0.050%), Immigrants from Jordan (27.1%, a difference of 0.060%), Palestinian (27.2%, a difference of 0.080%), and Immigrants from South Eastern Asia (27.1%, a difference of 0.10%).
| Demographics | Rating | Rank | Single Mother Poverty |
| Immigrants | Poland | 99.8 /100 | #48 | Exceptional 26.9% |
| Cambodians | 99.8 /100 | #49 | Exceptional 27.0% |
| Laotians | 99.8 /100 | #50 | Exceptional 27.0% |
| Immigrants | Argentina | 99.7 /100 | #51 | Exceptional 27.1% |
| Immigrants | South Eastern Asia | 99.7 /100 | #52 | Exceptional 27.1% |
| Immigrants | Jordan | 99.7 /100 | #53 | Exceptional 27.1% |
| Immigrants | Bulgaria | 99.7 /100 | #54 | Exceptional 27.1% |
| Immigrants | Egypt | 99.7 /100 | #55 | Exceptional 27.1% |
| Immigrants | Romania | 99.7 /100 | #56 | Exceptional 27.2% |
| Palestinians | 99.7 /100 | #57 | Exceptional 27.2% |
| Argentineans | 99.6 /100 | #58 | Exceptional 27.2% |
| Paraguayans | 99.6 /100 | #59 | Exceptional 27.2% |
| Eastern Europeans | 99.6 /100 | #60 | Exceptional 27.2% |
| Immigrants | Eastern Europe | 99.6 /100 | #61 | Exceptional 27.2% |
| Immigrants | Malaysia | 99.5 /100 | #62 | Exceptional 27.3% |