Nigerian vs Immigrants from Croatia Disability Age 35 to 64
COMPARE
Nigerian
Immigrants from Croatia
Disability Age 35 to 64
Disability Age 35 to 64 Comparison
Nigerians
Immigrants from Croatia
11.6%
DISABILITY AGE 35 TO 64
16.3/ 100
METRIC RATING
204th/ 347
METRIC RANK
10.2%
DISABILITY AGE 35 TO 64
99.3/ 100
METRIC RATING
80th/ 347
METRIC RANK
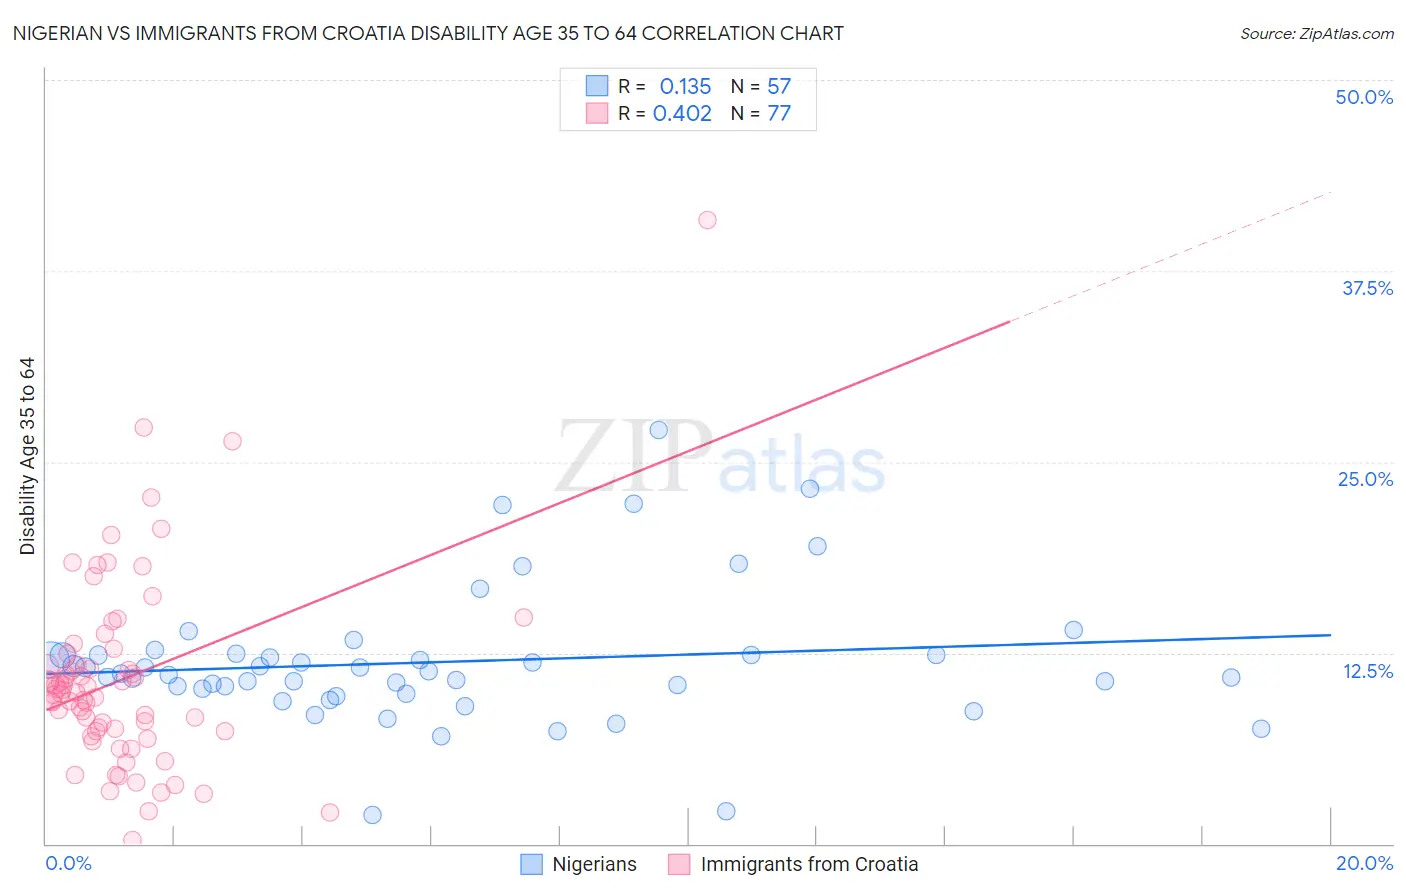
Nigerian vs Immigrants from Croatia Disability Age 35 to 64 Correlation Chart
The statistical analysis conducted on geographies consisting of 332,461,333 people shows a poor positive correlation between the proportion of Nigerians and percentage of population with a disability between the ages 34 and 64 in the United States with a correlation coefficient (R) of 0.135 and weighted average of 11.6%. Similarly, the statistical analysis conducted on geographies consisting of 132,570,235 people shows a moderate positive correlation between the proportion of Immigrants from Croatia and percentage of population with a disability between the ages 34 and 64 in the United States with a correlation coefficient (R) of 0.402 and weighted average of 10.2%, a difference of 14.6%.
Disability Age 35 to 64 Correlation Summary
| Measurement | Nigerian | Immigrants from Croatia |
| Minimum | 1.9% | 0.25% |
| Maximum | 27.1% | 40.9% |
| Range | 25.2% | 40.6% |
| Mean | 11.9% | 10.8% |
| Median | 11.2% | 9.9% |
| Interquartile 25% (IQ1) | 10.0% | 7.3% |
| Interquartile 75% (IQ3) | 12.4% | 12.0% |
| Interquartile Range (IQR) | 2.4% | 4.7% |
| Standard Deviation (Sample) | 4.5% | 6.3% |
| Standard Deviation (Population) | 4.4% | 6.3% |
Similar Demographics by Disability Age 35 to 64
Demographics Similar to Nigerians by Disability Age 35 to 64
In terms of disability age 35 to 64, the demographic groups most similar to Nigerians are British (11.6%, a difference of 0.11%), Slavic (11.7%, a difference of 0.11%), Immigrants from Guatemala (11.6%, a difference of 0.17%), Immigrants from Kenya (11.6%, a difference of 0.20%), and Native Hawaiian (11.7%, a difference of 0.21%).
| Demographics | Rating | Rank | Disability Age 35 to 64 |
| Immigrants | Iraq | 21.0 /100 | #197 | Fair 11.6% |
| Immigrants | Panama | 20.4 /100 | #198 | Fair 11.6% |
| Basques | 19.5 /100 | #199 | Poor 11.6% |
| Swiss | 18.7 /100 | #200 | Poor 11.6% |
| Immigrants | Kenya | 17.7 /100 | #201 | Poor 11.6% |
| Immigrants | Guatemala | 17.5 /100 | #202 | Poor 11.6% |
| British | 17.0 /100 | #203 | Poor 11.6% |
| Nigerians | 16.3 /100 | #204 | Poor 11.6% |
| Slavs | 15.5 /100 | #205 | Poor 11.7% |
| Native Hawaiians | 14.8 /100 | #206 | Poor 11.7% |
| Ghanaians | 14.8 /100 | #207 | Poor 11.7% |
| Guatemalans | 14.6 /100 | #208 | Poor 11.7% |
| Europeans | 13.5 /100 | #209 | Poor 11.7% |
| Belgians | 13.1 /100 | #210 | Poor 11.7% |
| Canadians | 13.0 /100 | #211 | Poor 11.7% |
Demographics Similar to Immigrants from Croatia by Disability Age 35 to 64
In terms of disability age 35 to 64, the demographic groups most similar to Immigrants from Croatia are Latvian (10.2%, a difference of 0.10%), Immigrants from Vietnam (10.1%, a difference of 0.13%), Russian (10.2%, a difference of 0.16%), Immigrants from Brazil (10.2%, a difference of 0.17%), and Jordanian (10.1%, a difference of 0.20%).
| Demographics | Rating | Rank | Disability Age 35 to 64 |
| Immigrants | France | 99.5 /100 | #73 | Exceptional 10.1% |
| Laotians | 99.4 /100 | #74 | Exceptional 10.1% |
| Immigrants | Latvia | 99.4 /100 | #75 | Exceptional 10.1% |
| Immigrants | Chile | 99.4 /100 | #76 | Exceptional 10.1% |
| Mongolians | 99.4 /100 | #77 | Exceptional 10.1% |
| Jordanians | 99.3 /100 | #78 | Exceptional 10.1% |
| Immigrants | Vietnam | 99.3 /100 | #79 | Exceptional 10.1% |
| Immigrants | Croatia | 99.3 /100 | #80 | Exceptional 10.2% |
| Latvians | 99.2 /100 | #81 | Exceptional 10.2% |
| Russians | 99.2 /100 | #82 | Exceptional 10.2% |
| Immigrants | Brazil | 99.2 /100 | #83 | Exceptional 10.2% |
| Sri Lankans | 99.2 /100 | #84 | Exceptional 10.2% |
| Immigrants | Kuwait | 99.1 /100 | #85 | Exceptional 10.2% |
| Immigrants | Europe | 99.1 /100 | #86 | Exceptional 10.2% |
| Nicaraguans | 99.1 /100 | #87 | Exceptional 10.2% |