Iraqi vs Immigrants from Belarus Single Father Poverty
COMPARE
Iraqi
Immigrants from Belarus
Single Father Poverty
Single Father Poverty Comparison
Iraqis
Immigrants from Belarus
15.9%
SINGLE FATHER POVERTY
91.2/ 100
METRIC RATING
125th/ 347
METRIC RANK
15.8%
SINGLE FATHER POVERTY
92.4/ 100
METRIC RATING
119th/ 347
METRIC RANK
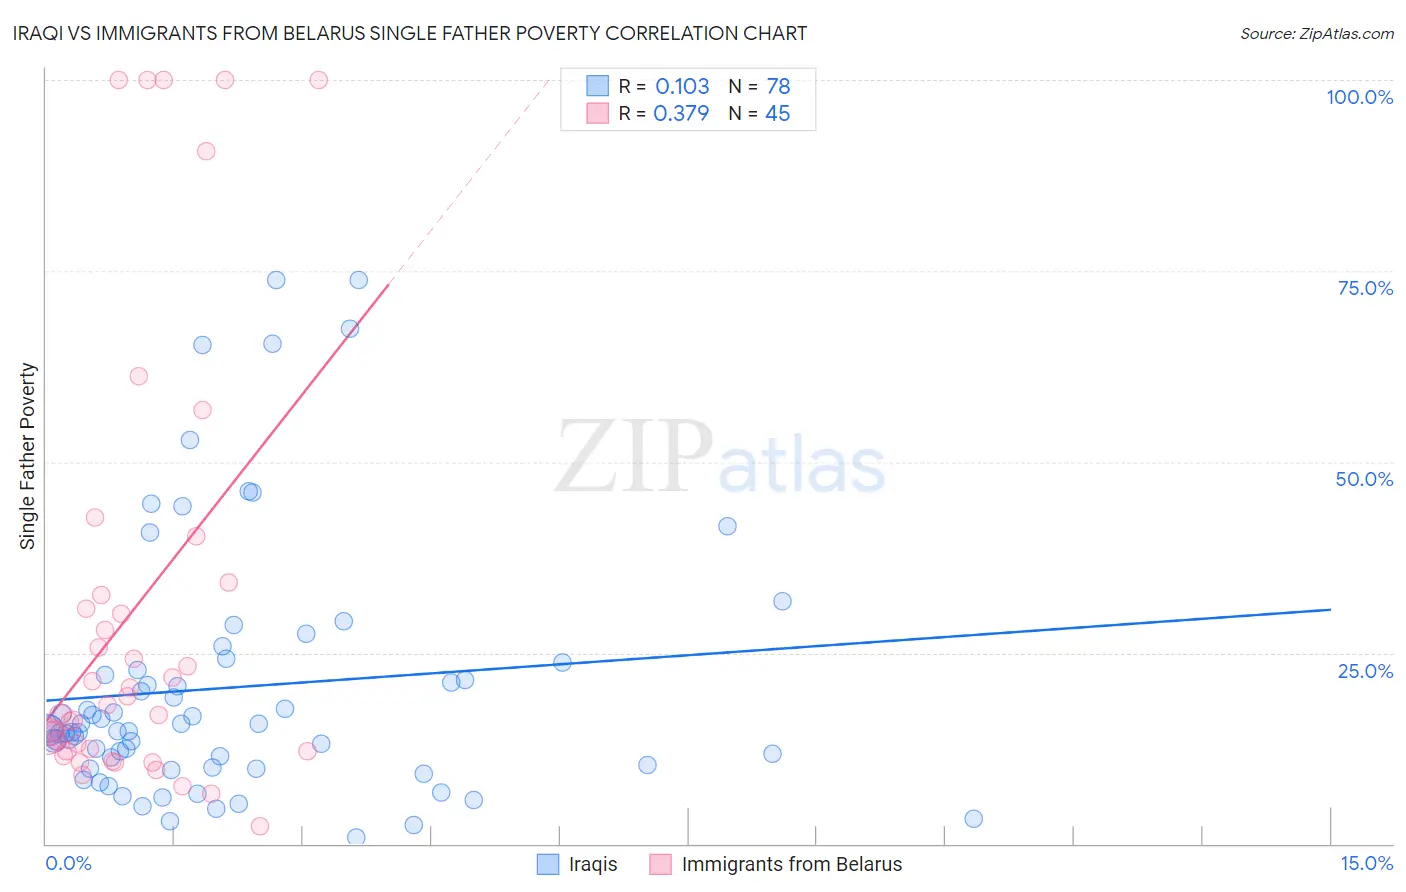
Iraqi vs Immigrants from Belarus Single Father Poverty Correlation Chart
The statistical analysis conducted on geographies consisting of 147,926,466 people shows a poor positive correlation between the proportion of Iraqis and poverty level among single fathers in the United States with a correlation coefficient (R) of 0.103 and weighted average of 15.9%. Similarly, the statistical analysis conducted on geographies consisting of 126,587,431 people shows a mild positive correlation between the proportion of Immigrants from Belarus and poverty level among single fathers in the United States with a correlation coefficient (R) of 0.379 and weighted average of 15.8%, a difference of 0.19%.
Single Father Poverty Correlation Summary
| Measurement | Iraqi | Immigrants from Belarus |
| Minimum | 0.90% | 2.4% |
| Maximum | 73.8% | 100.0% |
| Range | 72.9% | 97.6% |
| Mean | 20.5% | 30.7% |
| Median | 14.9% | 18.2% |
| Interquartile 25% (IQ1) | 10.0% | 12.1% |
| Interquartile 75% (IQ3) | 22.7% | 33.4% |
| Interquartile Range (IQR) | 12.8% | 21.3% |
| Standard Deviation (Sample) | 16.9% | 29.5% |
| Standard Deviation (Population) | 16.8% | 29.1% |
Demographics Similar to Iraqis and Immigrants from Belarus by Single Father Poverty
In terms of single father poverty, the demographic groups most similar to Iraqis are Immigrants from Panama (15.9%, a difference of 0.010%), Hmong (15.9%, a difference of 0.010%), Palestinian (15.9%, a difference of 0.020%), Immigrants from Liberia (15.9%, a difference of 0.020%), and Sudanese (15.9%, a difference of 0.050%). Similarly, the demographic groups most similar to Immigrants from Belarus are Immigrants from Eastern Europe (15.8%, a difference of 0.010%), Immigrants from Colombia (15.8%, a difference of 0.030%), Immigrants from Argentina (15.8%, a difference of 0.050%), Uruguayan (15.9%, a difference of 0.060%), and Immigrants (15.9%, a difference of 0.080%).
| Demographics | Rating | Rank | Single Father Poverty |
| Immigrants | Latvia | 94.7 /100 | #112 | Exceptional 15.8% |
| Danes | 94.5 /100 | #113 | Exceptional 15.8% |
| Argentineans | 94.4 /100 | #114 | Exceptional 15.8% |
| Immigrants | Thailand | 93.6 /100 | #115 | Exceptional 15.8% |
| Immigrants | Argentina | 92.8 /100 | #116 | Exceptional 15.8% |
| Immigrants | Colombia | 92.6 /100 | #117 | Exceptional 15.8% |
| Immigrants | Eastern Europe | 92.5 /100 | #118 | Exceptional 15.8% |
| Immigrants | Belarus | 92.4 /100 | #119 | Exceptional 15.8% |
| Uruguayans | 92.1 /100 | #120 | Exceptional 15.9% |
| Immigrants | Immigrants | 91.9 /100 | #121 | Exceptional 15.9% |
| Sudanese | 91.6 /100 | #122 | Exceptional 15.9% |
| Palestinians | 91.3 /100 | #123 | Exceptional 15.9% |
| Immigrants | Panama | 91.3 /100 | #124 | Exceptional 15.9% |
| Iraqis | 91.2 /100 | #125 | Exceptional 15.9% |
| Hmong | 91.1 /100 | #126 | Exceptional 15.9% |
| Immigrants | Liberia | 91.1 /100 | #127 | Exceptional 15.9% |
| Immigrants | Nigeria | 90.8 /100 | #128 | Exceptional 15.9% |
| Immigrants | West Indies | 90.8 /100 | #129 | Exceptional 15.9% |
| Norwegians | 90.2 /100 | #130 | Exceptional 15.9% |
| Nicaraguans | 90.1 /100 | #131 | Exceptional 15.9% |
| Immigrants | Portugal | 89.7 /100 | #132 | Excellent 15.9% |