Nigerian vs Immigrants from Belarus 6th Grade
COMPARE
Nigerian
Immigrants from Belarus
6th Grade
6th Grade Comparison
Nigerians
Immigrants from Belarus
96.6%
6TH GRADE
1.9/ 100
METRIC RATING
238th/ 347
METRIC RANK
97.1%
6TH GRADE
60.4/ 100
METRIC RATING
161st/ 347
METRIC RANK
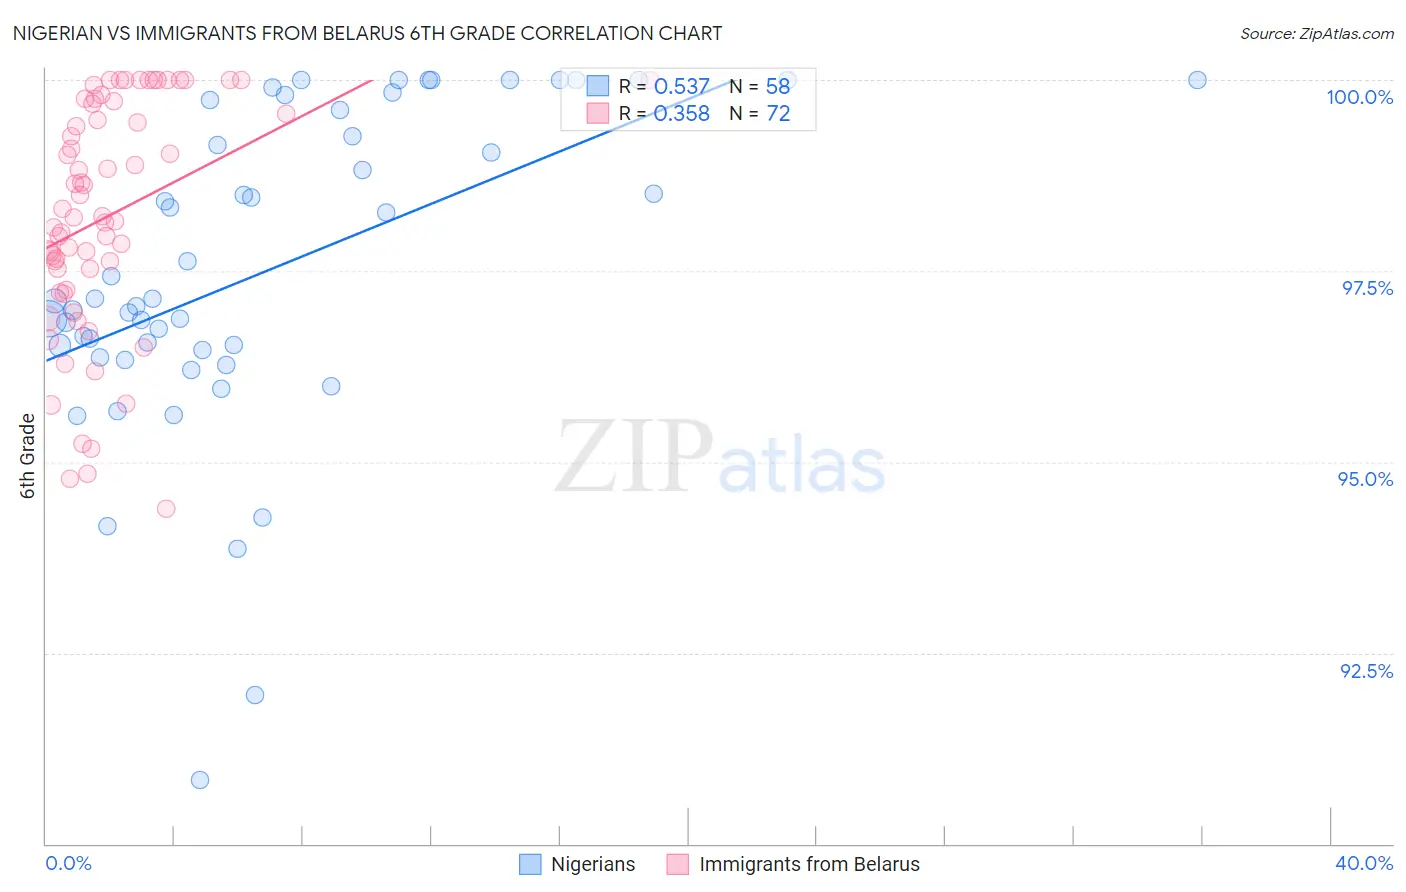
Nigerian vs Immigrants from Belarus 6th Grade Correlation Chart
The statistical analysis conducted on geographies consisting of 332,724,627 people shows a substantial positive correlation between the proportion of Nigerians and percentage of population with at least 6th grade education in the United States with a correlation coefficient (R) of 0.537 and weighted average of 96.6%. Similarly, the statistical analysis conducted on geographies consisting of 149,993,317 people shows a mild positive correlation between the proportion of Immigrants from Belarus and percentage of population with at least 6th grade education in the United States with a correlation coefficient (R) of 0.358 and weighted average of 97.1%, a difference of 0.50%.
6th Grade Correlation Summary
| Measurement | Nigerian | Immigrants from Belarus |
| Minimum | 90.8% | 94.4% |
| Maximum | 100.0% | 100.0% |
| Range | 9.2% | 5.6% |
| Mean | 97.5% | 98.2% |
| Median | 97.1% | 98.2% |
| Interquartile 25% (IQ1) | 96.5% | 97.4% |
| Interquartile 75% (IQ3) | 99.6% | 99.7% |
| Interquartile Range (IQR) | 3.1% | 2.3% |
| Standard Deviation (Sample) | 2.1% | 1.5% |
| Standard Deviation (Population) | 2.0% | 1.5% |
Similar Demographics by 6th Grade
Demographics Similar to Nigerians by 6th Grade
In terms of 6th grade, the demographic groups most similar to Nigerians are Indian (Asian) (96.6%, a difference of 0.0%), Korean (96.6%, a difference of 0.0%), Senegalese (96.6%, a difference of 0.0%), Immigrants from Eastern Africa (96.6%, a difference of 0.010%), and Immigrants from Asia (96.6%, a difference of 0.010%).
| Demographics | Rating | Rank | 6th Grade |
| Sub-Saharan Africans | 3.5 /100 | #231 | Tragic 96.7% |
| South American Indians | 3.5 /100 | #232 | Tragic 96.7% |
| Yuman | 3.2 /100 | #233 | Tragic 96.7% |
| Uruguayans | 2.5 /100 | #234 | Tragic 96.6% |
| Asians | 2.4 /100 | #235 | Tragic 96.6% |
| Immigrants | Indonesia | 2.3 /100 | #236 | Tragic 96.6% |
| Immigrants | Eastern Africa | 2.0 /100 | #237 | Tragic 96.6% |
| Nigerians | 1.9 /100 | #238 | Tragic 96.6% |
| Indians (Asian) | 1.9 /100 | #239 | Tragic 96.6% |
| Koreans | 1.9 /100 | #240 | Tragic 96.6% |
| Senegalese | 1.8 /100 | #241 | Tragic 96.6% |
| Immigrants | Asia | 1.8 /100 | #242 | Tragic 96.6% |
| Immigrants | Liberia | 1.6 /100 | #243 | Tragic 96.6% |
| Ethiopians | 1.5 /100 | #244 | Tragic 96.6% |
| Immigrants | Costa Rica | 1.3 /100 | #245 | Tragic 96.6% |
Demographics Similar to Immigrants from Belarus by 6th Grade
In terms of 6th grade, the demographic groups most similar to Immigrants from Belarus are Marshallese (97.1%, a difference of 0.0%), Immigrants from Iran (97.1%, a difference of 0.010%), Kenyan (97.1%, a difference of 0.010%), Ugandan (97.1%, a difference of 0.010%), and Albanian (97.1%, a difference of 0.010%).
| Demographics | Rating | Rank | 6th Grade |
| Soviet Union | 71.5 /100 | #154 | Good 97.2% |
| Ute | 71.1 /100 | #155 | Good 97.1% |
| Alsatians | 69.8 /100 | #156 | Good 97.1% |
| Immigrants | Russia | 67.6 /100 | #157 | Good 97.1% |
| Immigrants | Iran | 63.3 /100 | #158 | Good 97.1% |
| Kenyans | 62.9 /100 | #159 | Good 97.1% |
| Ugandans | 62.2 /100 | #160 | Good 97.1% |
| Immigrants | Belarus | 60.4 /100 | #161 | Good 97.1% |
| Marshallese | 60.2 /100 | #162 | Good 97.1% |
| Albanians | 57.8 /100 | #163 | Average 97.1% |
| Immigrants | Korea | 57.7 /100 | #164 | Average 97.1% |
| Immigrants | Poland | 56.2 /100 | #165 | Average 97.1% |
| Immigrants | Italy | 53.8 /100 | #166 | Average 97.1% |
| Apache | 53.6 /100 | #167 | Average 97.1% |
| Immigrants | Taiwan | 53.5 /100 | #168 | Average 97.1% |