Immigrants from Armenia vs Immigrants from Belarus Single Father Poverty
COMPARE
Immigrants from Armenia
Immigrants from Belarus
Single Father Poverty
Single Father Poverty Comparison
Immigrants from Armenia
Immigrants from Belarus
15.2%
SINGLE FATHER POVERTY
99.8/ 100
METRIC RATING
62nd/ 347
METRIC RANK
15.8%
SINGLE FATHER POVERTY
92.4/ 100
METRIC RATING
119th/ 347
METRIC RANK
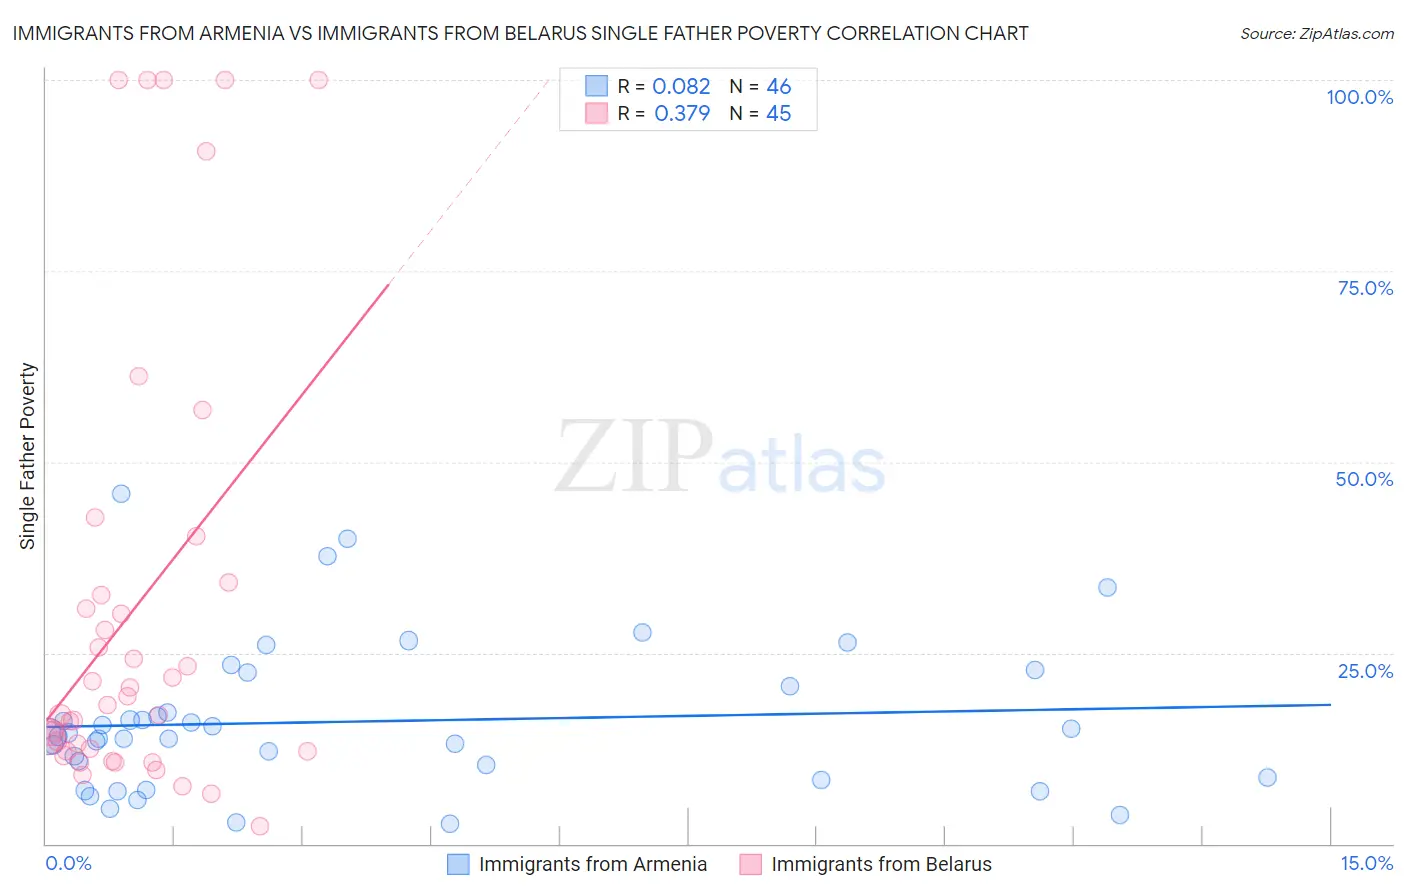
Immigrants from Armenia vs Immigrants from Belarus Single Father Poverty Correlation Chart
The statistical analysis conducted on geographies consisting of 86,819,015 people shows a slight positive correlation between the proportion of Immigrants from Armenia and poverty level among single fathers in the United States with a correlation coefficient (R) of 0.082 and weighted average of 15.2%. Similarly, the statistical analysis conducted on geographies consisting of 126,587,431 people shows a mild positive correlation between the proportion of Immigrants from Belarus and poverty level among single fathers in the United States with a correlation coefficient (R) of 0.379 and weighted average of 15.8%, a difference of 4.5%.
Single Father Poverty Correlation Summary
| Measurement | Immigrants from Armenia | Immigrants from Belarus |
| Minimum | 2.6% | 2.4% |
| Maximum | 45.8% | 100.0% |
| Range | 43.2% | 97.6% |
| Mean | 16.0% | 30.7% |
| Median | 14.1% | 18.2% |
| Interquartile 25% (IQ1) | 8.7% | 12.1% |
| Interquartile 75% (IQ3) | 20.6% | 33.4% |
| Interquartile Range (IQR) | 11.9% | 21.3% |
| Standard Deviation (Sample) | 9.8% | 29.5% |
| Standard Deviation (Population) | 9.6% | 29.1% |
Similar Demographics by Single Father Poverty
Demographics Similar to Immigrants from Armenia by Single Father Poverty
In terms of single father poverty, the demographic groups most similar to Immigrants from Armenia are Immigrants from Bosnia and Herzegovina (15.2%, a difference of 0.010%), Puget Sound Salish (15.2%, a difference of 0.050%), Immigrants from Sweden (15.2%, a difference of 0.090%), Bangladeshi (15.2%, a difference of 0.17%), and Immigrants from Malaysia (15.2%, a difference of 0.26%).
| Demographics | Rating | Rank | Single Father Poverty |
| Immigrants | Bulgaria | 99.9 /100 | #55 | Exceptional 15.0% |
| Immigrants | Laos | 99.9 /100 | #56 | Exceptional 15.1% |
| Laotians | 99.9 /100 | #57 | Exceptional 15.1% |
| Hawaiians | 99.9 /100 | #58 | Exceptional 15.1% |
| Guamanians/Chamorros | 99.9 /100 | #59 | Exceptional 15.1% |
| Puget Sound Salish | 99.8 /100 | #60 | Exceptional 15.2% |
| Immigrants | Bosnia and Herzegovina | 99.8 /100 | #61 | Exceptional 15.2% |
| Immigrants | Armenia | 99.8 /100 | #62 | Exceptional 15.2% |
| Immigrants | Sweden | 99.8 /100 | #63 | Exceptional 15.2% |
| Bangladeshis | 99.8 /100 | #64 | Exceptional 15.2% |
| Immigrants | Malaysia | 99.8 /100 | #65 | Exceptional 15.2% |
| Immigrants | Moldova | 99.8 /100 | #66 | Exceptional 15.2% |
| Paraguayans | 99.7 /100 | #67 | Exceptional 15.2% |
| Immigrants | Cameroon | 99.7 /100 | #68 | Exceptional 15.2% |
| Japanese | 99.7 /100 | #69 | Exceptional 15.2% |
Demographics Similar to Immigrants from Belarus by Single Father Poverty
In terms of single father poverty, the demographic groups most similar to Immigrants from Belarus are Immigrants from Eastern Europe (15.8%, a difference of 0.010%), Immigrants from Colombia (15.8%, a difference of 0.030%), Immigrants from Argentina (15.8%, a difference of 0.050%), Uruguayan (15.9%, a difference of 0.060%), and Immigrants (15.9%, a difference of 0.080%).
| Demographics | Rating | Rank | Single Father Poverty |
| Immigrants | Latvia | 94.7 /100 | #112 | Exceptional 15.8% |
| Danes | 94.5 /100 | #113 | Exceptional 15.8% |
| Argentineans | 94.4 /100 | #114 | Exceptional 15.8% |
| Immigrants | Thailand | 93.6 /100 | #115 | Exceptional 15.8% |
| Immigrants | Argentina | 92.8 /100 | #116 | Exceptional 15.8% |
| Immigrants | Colombia | 92.6 /100 | #117 | Exceptional 15.8% |
| Immigrants | Eastern Europe | 92.5 /100 | #118 | Exceptional 15.8% |
| Immigrants | Belarus | 92.4 /100 | #119 | Exceptional 15.8% |
| Uruguayans | 92.1 /100 | #120 | Exceptional 15.9% |
| Immigrants | Immigrants | 91.9 /100 | #121 | Exceptional 15.9% |
| Sudanese | 91.6 /100 | #122 | Exceptional 15.9% |
| Palestinians | 91.3 /100 | #123 | Exceptional 15.9% |
| Immigrants | Panama | 91.3 /100 | #124 | Exceptional 15.9% |
| Iraqis | 91.2 /100 | #125 | Exceptional 15.9% |
| Hmong | 91.1 /100 | #126 | Exceptional 15.9% |