Nicaraguan vs Immigrants from Kazakhstan Single Mother Poverty
COMPARE
Nicaraguan
Immigrants from Kazakhstan
Single Mother Poverty
Single Mother Poverty Comparison
Nicaraguans
Immigrants from Kazakhstan
29.8%
SINGLE MOTHER POVERTY
12.4/ 100
METRIC RATING
212th/ 347
METRIC RANK
28.2%
SINGLE MOTHER POVERTY
94.5/ 100
METRIC RATING
112th/ 347
METRIC RANK
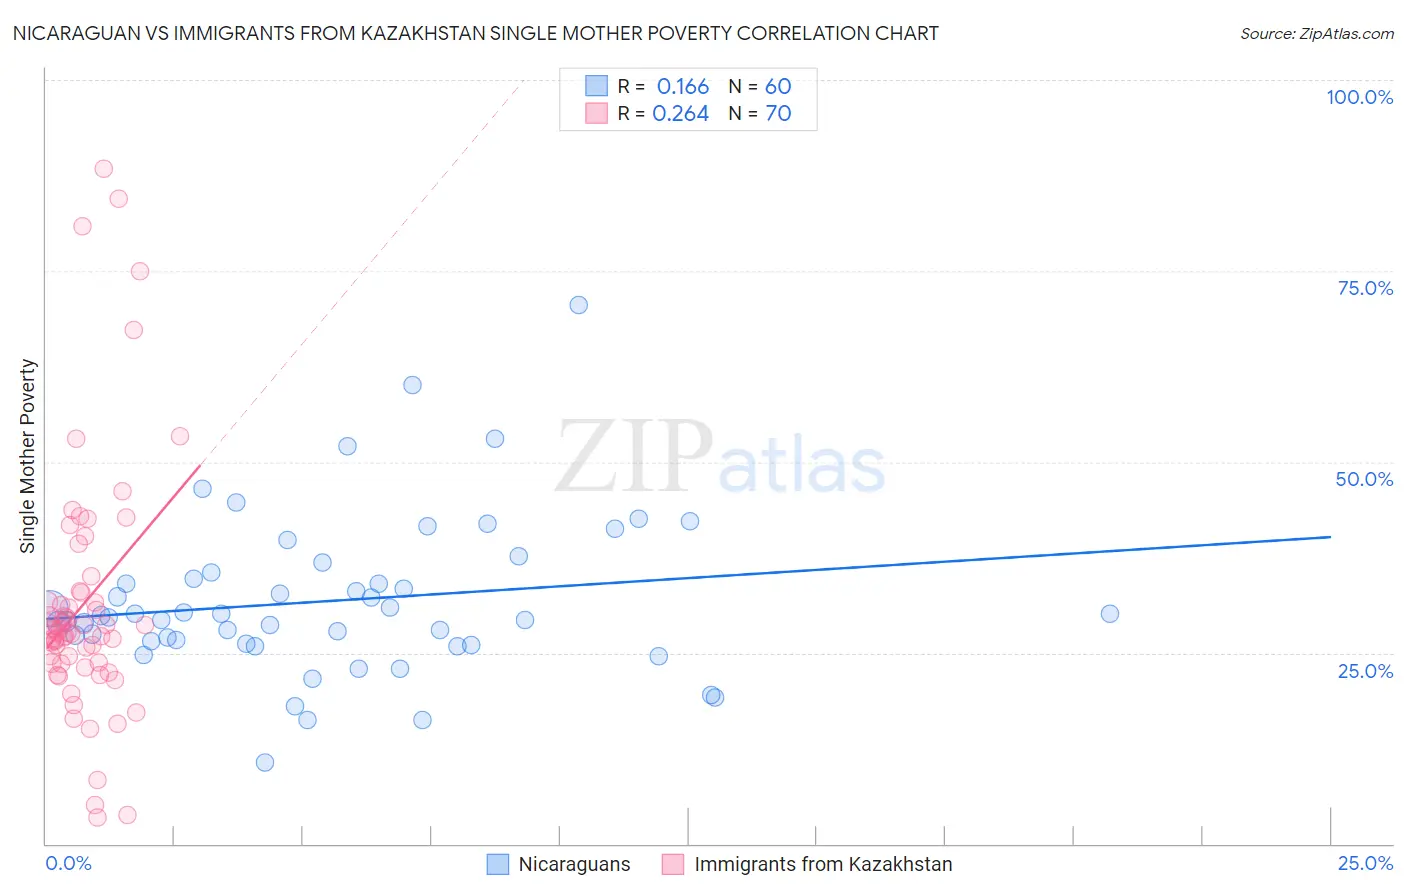
Nicaraguan vs Immigrants from Kazakhstan Single Mother Poverty Correlation Chart
The statistical analysis conducted on geographies consisting of 282,208,103 people shows a poor positive correlation between the proportion of Nicaraguans and poverty level among single mothers in the United States with a correlation coefficient (R) of 0.166 and weighted average of 29.8%. Similarly, the statistical analysis conducted on geographies consisting of 123,126,284 people shows a weak positive correlation between the proportion of Immigrants from Kazakhstan and poverty level among single mothers in the United States with a correlation coefficient (R) of 0.264 and weighted average of 28.2%, a difference of 5.9%.
Single Mother Poverty Correlation Summary
| Measurement | Nicaraguan | Immigrants from Kazakhstan |
| Minimum | 10.6% | 3.4% |
| Maximum | 70.6% | 88.4% |
| Range | 60.0% | 85.0% |
| Mean | 31.8% | 31.4% |
| Median | 29.7% | 27.9% |
| Interquartile 25% (IQ1) | 26.3% | 23.7% |
| Interquartile 75% (IQ3) | 35.1% | 32.9% |
| Interquartile Range (IQR) | 8.8% | 9.2% |
| Standard Deviation (Sample) | 10.4% | 16.5% |
| Standard Deviation (Population) | 10.3% | 16.4% |
Similar Demographics by Single Mother Poverty
Demographics Similar to Nicaraguans by Single Mother Poverty
In terms of single mother poverty, the demographic groups most similar to Nicaraguans are Guyanese (29.8%, a difference of 0.040%), Immigrants from Thailand (29.9%, a difference of 0.050%), Liberian (29.9%, a difference of 0.080%), Jamaican (29.9%, a difference of 0.080%), and Haitian (29.8%, a difference of 0.090%).
| Demographics | Rating | Rank | Single Mother Poverty |
| Czechoslovakians | 16.1 /100 | #205 | Poor 29.7% |
| Immigrants | Haiti | 15.8 /100 | #206 | Poor 29.7% |
| Immigrants | Panama | 15.5 /100 | #207 | Poor 29.8% |
| Immigrants | Guyana | 14.7 /100 | #208 | Poor 29.8% |
| Irish | 13.9 /100 | #209 | Poor 29.8% |
| Haitians | 13.3 /100 | #210 | Poor 29.8% |
| Guyanese | 12.8 /100 | #211 | Poor 29.8% |
| Nicaraguans | 12.4 /100 | #212 | Poor 29.8% |
| Immigrants | Thailand | 12.0 /100 | #213 | Poor 29.9% |
| Liberians | 11.7 /100 | #214 | Poor 29.9% |
| Jamaicans | 11.7 /100 | #215 | Poor 29.9% |
| Immigrants | Western Africa | 11.5 /100 | #216 | Poor 29.9% |
| Immigrants | Ghana | 11.3 /100 | #217 | Poor 29.9% |
| Hungarians | 10.3 /100 | #218 | Poor 29.9% |
| Finns | 9.3 /100 | #219 | Tragic 30.0% |
Demographics Similar to Immigrants from Kazakhstan by Single Mother Poverty
In terms of single mother poverty, the demographic groups most similar to Immigrants from Kazakhstan are Venezuelan (28.2%, a difference of 0.010%), Croatian (28.2%, a difference of 0.060%), Immigrants from Armenia (28.1%, a difference of 0.19%), Immigrants from Zimbabwe (28.1%, a difference of 0.28%), and Immigrants from South Africa (28.3%, a difference of 0.28%).
| Demographics | Rating | Rank | Single Mother Poverty |
| Israelis | 96.5 /100 | #105 | Exceptional 28.0% |
| Ukrainians | 96.4 /100 | #106 | Exceptional 28.0% |
| Immigrants | Venezuela | 95.8 /100 | #107 | Exceptional 28.1% |
| Immigrants | Zimbabwe | 95.5 /100 | #108 | Exceptional 28.1% |
| Immigrants | Armenia | 95.2 /100 | #109 | Exceptional 28.1% |
| Croatians | 94.8 /100 | #110 | Exceptional 28.2% |
| Venezuelans | 94.5 /100 | #111 | Exceptional 28.2% |
| Immigrants | Kazakhstan | 94.5 /100 | #112 | Exceptional 28.2% |
| Immigrants | South Africa | 93.2 /100 | #113 | Exceptional 28.3% |
| Immigrants | Western Asia | 92.7 /100 | #114 | Exceptional 28.3% |
| Immigrants | Kuwait | 92.7 /100 | #115 | Exceptional 28.3% |
| Immigrants | Uganda | 92.5 /100 | #116 | Exceptional 28.3% |
| Australians | 92.5 /100 | #117 | Exceptional 28.3% |
| Brazilians | 92.4 /100 | #118 | Exceptional 28.3% |
| Immigrants | Syria | 92.4 /100 | #119 | Exceptional 28.3% |