Nicaraguan vs Japanese Female Poverty Among 18-24 Year Olds
COMPARE
Nicaraguan
Japanese
Female Poverty Among 18-24 Year Olds
Female Poverty Among 18-24 Year Olds Comparison
Nicaraguans
Japanese
18.1%
FEMALE POVERTY AMONG 18-24 YEAR OLDS
100.0/ 100
METRIC RATING
44th/ 347
METRIC RANK
18.8%
FEMALE POVERTY AMONG 18-24 YEAR OLDS
99.5/ 100
METRIC RATING
81st/ 347
METRIC RANK
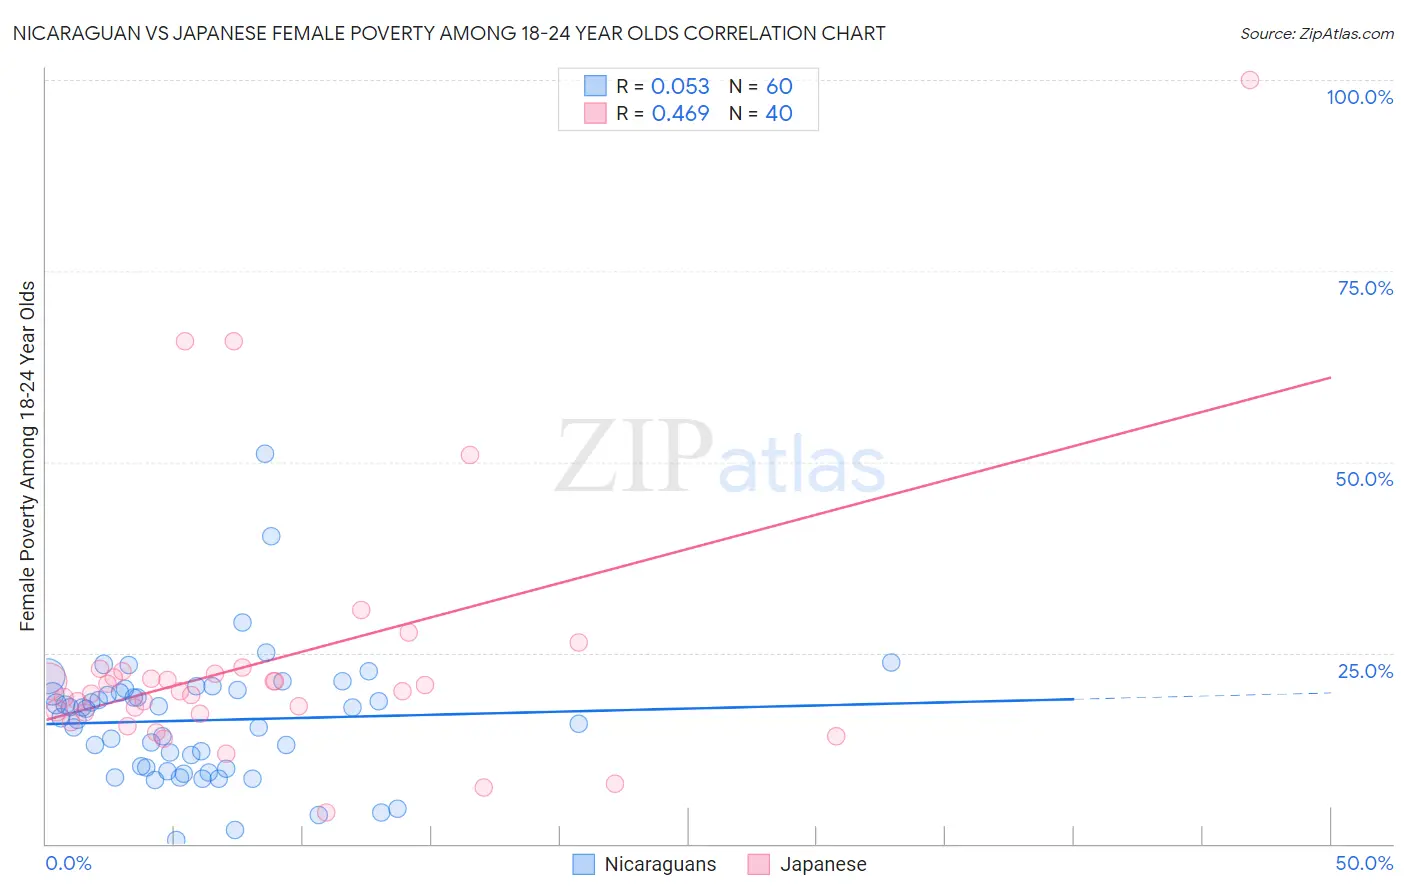
Nicaraguan vs Japanese Female Poverty Among 18-24 Year Olds Correlation Chart
The statistical analysis conducted on geographies consisting of 282,283,725 people shows a slight positive correlation between the proportion of Nicaraguans and poverty level among females between the ages 18 and 24 in the United States with a correlation coefficient (R) of 0.053 and weighted average of 18.1%. Similarly, the statistical analysis conducted on geographies consisting of 246,409,526 people shows a moderate positive correlation between the proportion of Japanese and poverty level among females between the ages 18 and 24 in the United States with a correlation coefficient (R) of 0.469 and weighted average of 18.8%, a difference of 4.0%.
Female Poverty Among 18-24 Year Olds Correlation Summary
| Measurement | Nicaraguan | Japanese |
| Minimum | 0.55% | 4.1% |
| Maximum | 51.1% | 100.0% |
| Range | 50.6% | 95.9% |
| Mean | 16.2% | 23.9% |
| Median | 17.1% | 20.0% |
| Interquartile 25% (IQ1) | 9.9% | 17.1% |
| Interquartile 75% (IQ3) | 19.9% | 22.4% |
| Interquartile Range (IQR) | 10.1% | 5.3% |
| Standard Deviation (Sample) | 8.3% | 17.5% |
| Standard Deviation (Population) | 8.3% | 17.3% |
Similar Demographics by Female Poverty Among 18-24 Year Olds
Demographics Similar to Nicaraguans by Female Poverty Among 18-24 Year Olds
In terms of female poverty among 18-24 year olds, the demographic groups most similar to Nicaraguans are Macedonian (18.1%, a difference of 0.080%), Bulgarian (18.1%, a difference of 0.090%), Spanish American Indian (18.1%, a difference of 0.090%), Immigrants from Southern Europe (18.2%, a difference of 0.38%), and Asian (18.2%, a difference of 0.46%).
| Demographics | Rating | Rank | Female Poverty Among 18-24 Year Olds |
| Immigrants | Croatia | 100.0 /100 | #37 | Exceptional 17.9% |
| South Americans | 100.0 /100 | #38 | Exceptional 18.0% |
| Puget Sound Salish | 100.0 /100 | #39 | Exceptional 18.0% |
| Immigrants | Romania | 100.0 /100 | #40 | Exceptional 18.0% |
| Immigrants | Argentina | 100.0 /100 | #41 | Exceptional 18.0% |
| Bulgarians | 100.0 /100 | #42 | Exceptional 18.1% |
| Macedonians | 100.0 /100 | #43 | Exceptional 18.1% |
| Nicaraguans | 100.0 /100 | #44 | Exceptional 18.1% |
| Spanish American Indians | 100.0 /100 | #45 | Exceptional 18.1% |
| Immigrants | Southern Europe | 100.0 /100 | #46 | Exceptional 18.2% |
| Asians | 100.0 /100 | #47 | Exceptional 18.2% |
| Sri Lankans | 100.0 /100 | #48 | Exceptional 18.2% |
| Bhutanese | 100.0 /100 | #49 | Exceptional 18.2% |
| Samoans | 100.0 /100 | #50 | Exceptional 18.2% |
| Immigrants | Eastern Europe | 99.9 /100 | #51 | Exceptional 18.2% |
Demographics Similar to Japanese by Female Poverty Among 18-24 Year Olds
In terms of female poverty among 18-24 year olds, the demographic groups most similar to Japanese are Palestinian (18.8%, a difference of 0.0%), Immigrants from Europe (18.8%, a difference of 0.080%), Uruguayan (18.8%, a difference of 0.080%), Costa Rican (18.8%, a difference of 0.090%), and Immigrants from Uruguay (18.8%, a difference of 0.11%).
| Demographics | Rating | Rank | Female Poverty Among 18-24 Year Olds |
| Hawaiians | 99.6 /100 | #74 | Exceptional 18.7% |
| Poles | 99.6 /100 | #75 | Exceptional 18.8% |
| Immigrants | Cambodia | 99.5 /100 | #76 | Exceptional 18.8% |
| Costa Ricans | 99.5 /100 | #77 | Exceptional 18.8% |
| Immigrants | Europe | 99.5 /100 | #78 | Exceptional 18.8% |
| Uruguayans | 99.5 /100 | #79 | Exceptional 18.8% |
| Palestinians | 99.5 /100 | #80 | Exceptional 18.8% |
| Japanese | 99.5 /100 | #81 | Exceptional 18.8% |
| Immigrants | Uruguay | 99.4 /100 | #82 | Exceptional 18.8% |
| Immigrants | Indonesia | 99.4 /100 | #83 | Exceptional 18.9% |
| Burmese | 99.2 /100 | #84 | Exceptional 18.9% |
| Immigrants | Armenia | 99.2 /100 | #85 | Exceptional 18.9% |
| Immigrants | Iraq | 99.2 /100 | #86 | Exceptional 18.9% |
| Immigrants | Jamaica | 99.2 /100 | #87 | Exceptional 18.9% |
| Croatians | 99.1 /100 | #88 | Exceptional 19.0% |