Nicaraguan vs Immigrants from Pakistan Female Poverty Among 18-24 Year Olds
COMPARE
Nicaraguan
Immigrants from Pakistan
Female Poverty Among 18-24 Year Olds
Female Poverty Among 18-24 Year Olds Comparison
Nicaraguans
Immigrants from Pakistan
18.1%
FEMALE POVERTY AMONG 18-24 YEAR OLDS
100.0/ 100
METRIC RATING
44th/ 347
METRIC RANK
17.0%
FEMALE POVERTY AMONG 18-24 YEAR OLDS
100.0/ 100
METRIC RATING
12th/ 347
METRIC RANK
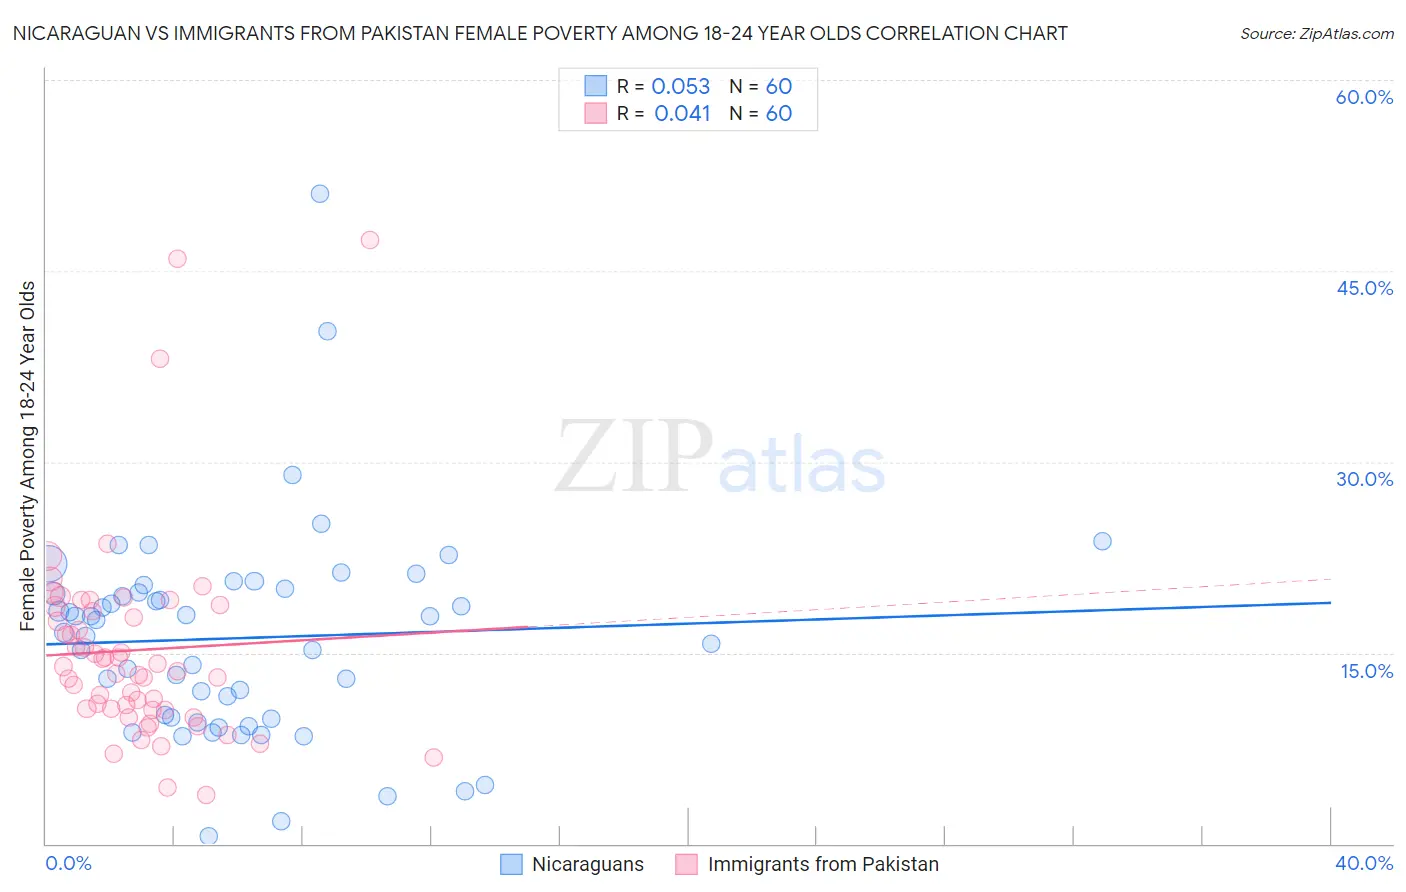
Nicaraguan vs Immigrants from Pakistan Female Poverty Among 18-24 Year Olds Correlation Chart
The statistical analysis conducted on geographies consisting of 282,283,725 people shows a slight positive correlation between the proportion of Nicaraguans and poverty level among females between the ages 18 and 24 in the United States with a correlation coefficient (R) of 0.053 and weighted average of 18.1%. Similarly, the statistical analysis conducted on geographies consisting of 279,566,412 people shows no correlation between the proportion of Immigrants from Pakistan and poverty level among females between the ages 18 and 24 in the United States with a correlation coefficient (R) of 0.041 and weighted average of 17.0%, a difference of 6.5%.
Female Poverty Among 18-24 Year Olds Correlation Summary
| Measurement | Nicaraguan | Immigrants from Pakistan |
| Minimum | 0.55% | 3.8% |
| Maximum | 51.1% | 47.5% |
| Range | 50.6% | 43.6% |
| Mean | 16.2% | 15.2% |
| Median | 17.1% | 13.7% |
| Interquartile 25% (IQ1) | 9.9% | 10.5% |
| Interquartile 75% (IQ3) | 19.9% | 18.5% |
| Interquartile Range (IQR) | 10.1% | 7.9% |
| Standard Deviation (Sample) | 8.3% | 8.0% |
| Standard Deviation (Population) | 8.3% | 8.0% |
Similar Demographics by Female Poverty Among 18-24 Year Olds
Demographics Similar to Nicaraguans by Female Poverty Among 18-24 Year Olds
In terms of female poverty among 18-24 year olds, the demographic groups most similar to Nicaraguans are Macedonian (18.1%, a difference of 0.080%), Bulgarian (18.1%, a difference of 0.090%), Spanish American Indian (18.1%, a difference of 0.090%), Immigrants from Southern Europe (18.2%, a difference of 0.38%), and Asian (18.2%, a difference of 0.46%).
| Demographics | Rating | Rank | Female Poverty Among 18-24 Year Olds |
| Immigrants | Croatia | 100.0 /100 | #37 | Exceptional 17.9% |
| South Americans | 100.0 /100 | #38 | Exceptional 18.0% |
| Puget Sound Salish | 100.0 /100 | #39 | Exceptional 18.0% |
| Immigrants | Romania | 100.0 /100 | #40 | Exceptional 18.0% |
| Immigrants | Argentina | 100.0 /100 | #41 | Exceptional 18.0% |
| Bulgarians | 100.0 /100 | #42 | Exceptional 18.1% |
| Macedonians | 100.0 /100 | #43 | Exceptional 18.1% |
| Nicaraguans | 100.0 /100 | #44 | Exceptional 18.1% |
| Spanish American Indians | 100.0 /100 | #45 | Exceptional 18.1% |
| Immigrants | Southern Europe | 100.0 /100 | #46 | Exceptional 18.2% |
| Asians | 100.0 /100 | #47 | Exceptional 18.2% |
| Sri Lankans | 100.0 /100 | #48 | Exceptional 18.2% |
| Bhutanese | 100.0 /100 | #49 | Exceptional 18.2% |
| Samoans | 100.0 /100 | #50 | Exceptional 18.2% |
| Immigrants | Eastern Europe | 99.9 /100 | #51 | Exceptional 18.2% |
Demographics Similar to Immigrants from Pakistan by Female Poverty Among 18-24 Year Olds
In terms of female poverty among 18-24 year olds, the demographic groups most similar to Immigrants from Pakistan are Thai (17.0%, a difference of 0.090%), Korean (16.9%, a difference of 0.36%), Immigrants from Poland (17.1%, a difference of 0.66%), Immigrants from Peru (16.9%, a difference of 0.72%), and Tongan (17.1%, a difference of 0.83%).
| Demographics | Rating | Rank | Female Poverty Among 18-24 Year Olds |
| Immigrants | Portugal | 100.0 /100 | #5 | Exceptional 16.5% |
| Immigrants | Philippines | 100.0 /100 | #6 | Exceptional 16.7% |
| Immigrants | Azores | 100.0 /100 | #7 | Exceptional 16.7% |
| Immigrants | Bolivia | 100.0 /100 | #8 | Exceptional 16.7% |
| Immigrants | Peru | 100.0 /100 | #9 | Exceptional 16.9% |
| Koreans | 100.0 /100 | #10 | Exceptional 16.9% |
| Thais | 100.0 /100 | #11 | Exceptional 17.0% |
| Immigrants | Pakistan | 100.0 /100 | #12 | Exceptional 17.0% |
| Immigrants | Poland | 100.0 /100 | #13 | Exceptional 17.1% |
| Tongans | 100.0 /100 | #14 | Exceptional 17.1% |
| Cubans | 100.0 /100 | #15 | Exceptional 17.2% |
| Peruvians | 100.0 /100 | #16 | Exceptional 17.2% |
| Immigrants | Taiwan | 100.0 /100 | #17 | Exceptional 17.3% |
| Immigrants | Colombia | 100.0 /100 | #18 | Exceptional 17.3% |
| Immigrants | Lithuania | 100.0 /100 | #19 | Exceptional 17.4% |