Nicaraguan vs African Male Poverty
COMPARE
Nicaraguan
African
Male Poverty
Male Poverty Comparison
Nicaraguans
Africans
12.6%
MALE POVERTY
0.6/ 100
METRIC RATING
232nd/ 347
METRIC RANK
14.2%
MALE POVERTY
0.0/ 100
METRIC RATING
308th/ 347
METRIC RANK
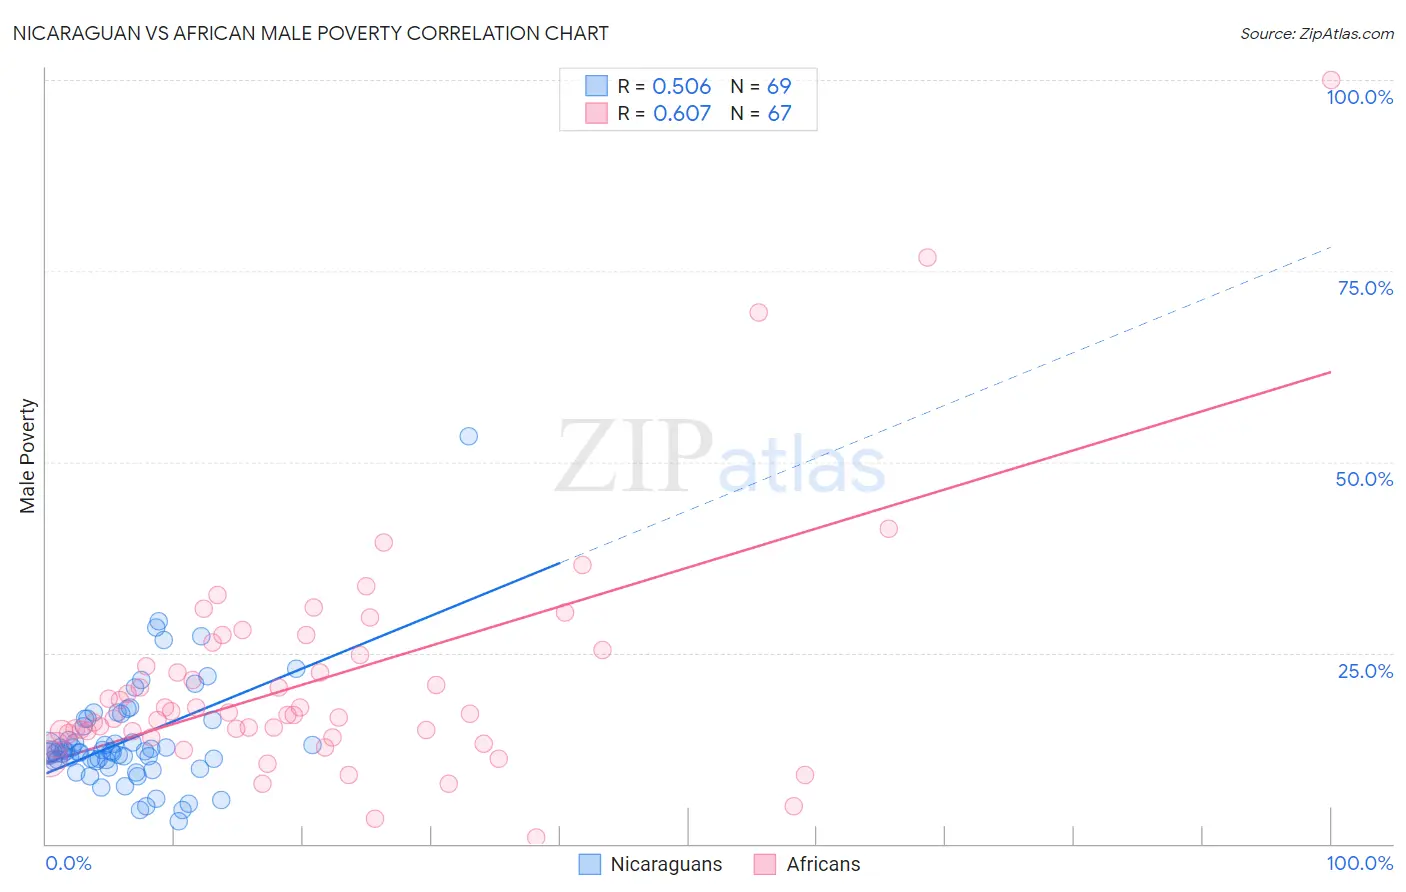
Nicaraguan vs African Male Poverty Correlation Chart
The statistical analysis conducted on geographies consisting of 285,585,810 people shows a substantial positive correlation between the proportion of Nicaraguans and poverty level among males in the United States with a correlation coefficient (R) of 0.506 and weighted average of 12.6%. Similarly, the statistical analysis conducted on geographies consisting of 469,483,422 people shows a significant positive correlation between the proportion of Africans and poverty level among males in the United States with a correlation coefficient (R) of 0.607 and weighted average of 14.2%, a difference of 12.9%.
Male Poverty Correlation Summary
| Measurement | Nicaraguan | African |
| Minimum | 2.9% | 0.81% |
| Maximum | 53.4% | 100.0% |
| Range | 50.5% | 99.2% |
| Mean | 13.7% | 21.5% |
| Median | 12.1% | 17.0% |
| Interquartile 25% (IQ1) | 10.9% | 14.4% |
| Interquartile 75% (IQ3) | 16.3% | 25.4% |
| Interquartile Range (IQR) | 5.4% | 10.9% |
| Standard Deviation (Sample) | 7.3% | 15.8% |
| Standard Deviation (Population) | 7.3% | 15.7% |
Similar Demographics by Male Poverty
Demographics Similar to Nicaraguans by Male Poverty
In terms of male poverty, the demographic groups most similar to Nicaraguans are Fijian (12.6%, a difference of 0.050%), Immigrants from Armenia (12.6%, a difference of 0.11%), Salvadoran (12.6%, a difference of 0.12%), Immigrants from Laos (12.6%, a difference of 0.47%), and Marshallese (12.5%, a difference of 0.68%).
| Demographics | Rating | Rank | Male Poverty |
| Osage | 1.5 /100 | #225 | Tragic 12.3% |
| Nigerians | 1.4 /100 | #226 | Tragic 12.3% |
| Alaska Natives | 1.4 /100 | #227 | Tragic 12.4% |
| Alsatians | 1.3 /100 | #228 | Tragic 12.4% |
| Cubans | 1.3 /100 | #229 | Tragic 12.4% |
| Marshallese | 0.8 /100 | #230 | Tragic 12.5% |
| Salvadorans | 0.6 /100 | #231 | Tragic 12.6% |
| Nicaraguans | 0.6 /100 | #232 | Tragic 12.6% |
| Fijians | 0.6 /100 | #233 | Tragic 12.6% |
| Immigrants | Armenia | 0.6 /100 | #234 | Tragic 12.6% |
| Immigrants | Laos | 0.5 /100 | #235 | Tragic 12.6% |
| Immigrants | Saudi Arabia | 0.4 /100 | #236 | Tragic 12.7% |
| French American Indians | 0.4 /100 | #237 | Tragic 12.7% |
| Ecuadorians | 0.4 /100 | #238 | Tragic 12.7% |
| Ghanaians | 0.4 /100 | #239 | Tragic 12.7% |
Demographics Similar to Africans by Male Poverty
In terms of male poverty, the demographic groups most similar to Africans are Dutch West Indian (14.2%, a difference of 0.020%), Somali (14.3%, a difference of 0.38%), Seminole (14.3%, a difference of 0.58%), Creek (14.1%, a difference of 0.71%), and Immigrants from Bangladesh (14.1%, a difference of 0.78%).
| Demographics | Rating | Rank | Male Poverty |
| Immigrants | Senegal | 0.0 /100 | #301 | Tragic 14.0% |
| Immigrants | Caribbean | 0.0 /100 | #302 | Tragic 14.0% |
| Bahamians | 0.0 /100 | #303 | Tragic 14.1% |
| Senegalese | 0.0 /100 | #304 | Tragic 14.1% |
| Immigrants | Bangladesh | 0.0 /100 | #305 | Tragic 14.1% |
| Creek | 0.0 /100 | #306 | Tragic 14.1% |
| Dutch West Indians | 0.0 /100 | #307 | Tragic 14.2% |
| Africans | 0.0 /100 | #308 | Tragic 14.2% |
| Somalis | 0.0 /100 | #309 | Tragic 14.3% |
| Seminole | 0.0 /100 | #310 | Tragic 14.3% |
| Hondurans | 0.0 /100 | #311 | Tragic 14.3% |
| Choctaw | 0.0 /100 | #312 | Tragic 14.4% |
| Immigrants | Somalia | 0.0 /100 | #313 | Tragic 14.6% |
| Immigrants | Honduras | 0.0 /100 | #314 | Tragic 14.6% |
| Chippewa | 0.0 /100 | #315 | Tragic 14.6% |