Nicaraguan vs African Householder Income Under 25 years
COMPARE
Nicaraguan
African
Householder Income Under 25 years
Householder Income Under 25 years Comparison
Nicaraguans
Africans
$53,275
HOUSEHOLDER INCOME UNDER 25 YEARS
93.4/ 100
METRIC RATING
130th/ 347
METRIC RANK
$46,838
HOUSEHOLDER INCOME UNDER 25 YEARS
0.0/ 100
METRIC RATING
319th/ 347
METRIC RANK
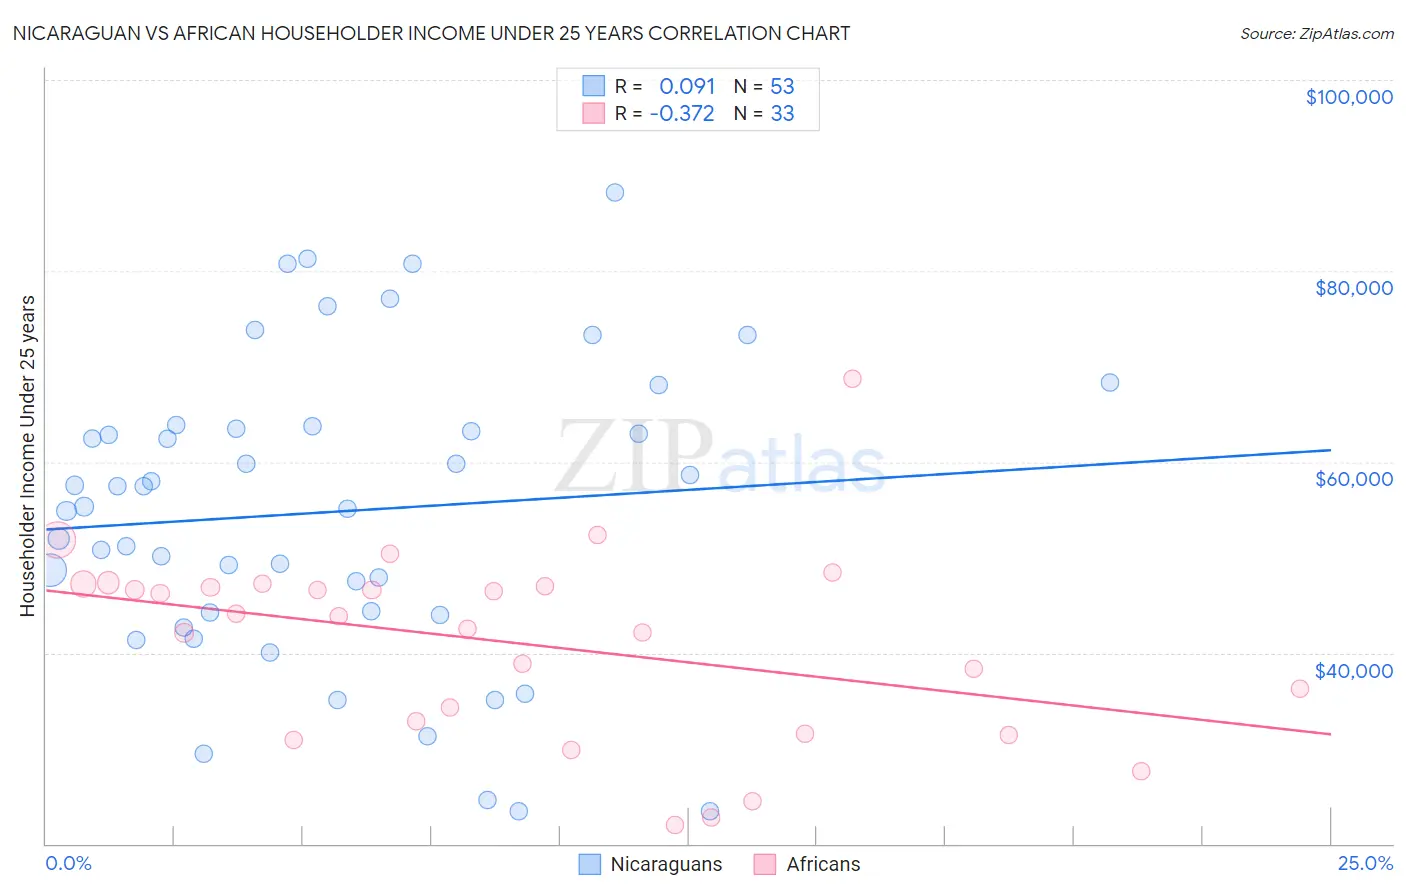
Nicaraguan vs African Householder Income Under 25 years Correlation Chart
The statistical analysis conducted on geographies consisting of 251,521,022 people shows a slight positive correlation between the proportion of Nicaraguans and household income with householder under the age of 25 in the United States with a correlation coefficient (R) of 0.091 and weighted average of $53,275. Similarly, the statistical analysis conducted on geographies consisting of 392,403,445 people shows a mild negative correlation between the proportion of Africans and household income with householder under the age of 25 in the United States with a correlation coefficient (R) of -0.372 and weighted average of $46,838, a difference of 13.7%.
Householder Income Under 25 years Correlation Summary
| Measurement | Nicaraguan | African |
| Minimum | $23,354 | $21,932 |
| Maximum | $88,274 | $68,731 |
| Range | $64,920 | $46,799 |
| Mean | $54,761 | $41,066 |
| Median | $55,328 | $43,851 |
| Interquartile 25% (IQ1) | $44,098 | $32,121 |
| Interquartile 75% (IQ3) | $63,651 | $47,071 |
| Interquartile Range (IQR) | $19,552 | $14,950 |
| Standard Deviation (Sample) | $15,647 | $10,046 |
| Standard Deviation (Population) | $15,499 | $9,893 |
Similar Demographics by Householder Income Under 25 years
Demographics Similar to Nicaraguans by Householder Income Under 25 years
In terms of householder income under 25 years, the demographic groups most similar to Nicaraguans are Immigrants from Nicaragua ($53,266, a difference of 0.020%), Moroccan ($53,256, a difference of 0.030%), New Zealander ($53,294, a difference of 0.040%), Immigrants from North America ($53,307, a difference of 0.060%), and Immigrants from Bulgaria ($53,305, a difference of 0.060%).
| Demographics | Rating | Rank | Householder Income Under 25 years |
| Immigrants | Iraq | 94.9 /100 | #123 | Exceptional $53,384 |
| Colombians | 94.6 /100 | #124 | Exceptional $53,357 |
| Pakistanis | 94.1 /100 | #125 | Exceptional $53,325 |
| Immigrants | Serbia | 94.1 /100 | #126 | Exceptional $53,321 |
| Immigrants | North America | 93.9 /100 | #127 | Exceptional $53,307 |
| Immigrants | Bulgaria | 93.9 /100 | #128 | Exceptional $53,305 |
| New Zealanders | 93.7 /100 | #129 | Exceptional $53,294 |
| Nicaraguans | 93.4 /100 | #130 | Exceptional $53,275 |
| Immigrants | Nicaragua | 93.3 /100 | #131 | Exceptional $53,266 |
| Moroccans | 93.1 /100 | #132 | Exceptional $53,256 |
| Immigrants | Immigrants | 92.2 /100 | #133 | Exceptional $53,201 |
| Immigrants | Northern Africa | 91.9 /100 | #134 | Exceptional $53,185 |
| Chileans | 91.9 /100 | #135 | Exceptional $53,185 |
| Armenians | 91.8 /100 | #136 | Exceptional $53,179 |
| Immigrants | Barbados | 91.5 /100 | #137 | Exceptional $53,163 |
Demographics Similar to Africans by Householder Income Under 25 years
In terms of householder income under 25 years, the demographic groups most similar to Africans are Immigrants from Sudan ($46,791, a difference of 0.10%), Spanish American ($46,913, a difference of 0.16%), Hopi ($46,978, a difference of 0.30%), Sudanese ($46,982, a difference of 0.31%), and Crow ($47,012, a difference of 0.37%).
| Demographics | Rating | Rank | Householder Income Under 25 years |
| Bermudans | 0.0 /100 | #312 | Tragic $47,359 |
| Delaware | 0.0 /100 | #313 | Tragic $47,159 |
| Chippewa | 0.0 /100 | #314 | Tragic $47,015 |
| Crow | 0.0 /100 | #315 | Tragic $47,012 |
| Sudanese | 0.0 /100 | #316 | Tragic $46,982 |
| Hopi | 0.0 /100 | #317 | Tragic $46,978 |
| Spanish Americans | 0.0 /100 | #318 | Tragic $46,913 |
| Africans | 0.0 /100 | #319 | Tragic $46,838 |
| Immigrants | Sudan | 0.0 /100 | #320 | Tragic $46,791 |
| Potawatomi | 0.0 /100 | #321 | Tragic $46,462 |
| Sioux | 0.0 /100 | #322 | Tragic $46,417 |
| Immigrants | Saudi Arabia | 0.0 /100 | #323 | Tragic $46,187 |
| Dutch West Indians | 0.0 /100 | #324 | Tragic $45,816 |
| Immigrants | Bahamas | 0.0 /100 | #325 | Tragic $45,793 |
| Osage | 0.0 /100 | #326 | Tragic $45,764 |