Nicaraguan vs African Unemployment Among Ages 16 to 19 years
COMPARE
Nicaraguan
African
Unemployment Among Ages 16 to 19 years
Unemployment Among Ages 16 to 19 years Comparison
Nicaraguans
Africans
17.6%
UNEMPLOYMENT AMONG AGES 16 TO 19 YEARS
48.9/ 100
METRIC RATING
176th/ 347
METRIC RANK
19.5%
UNEMPLOYMENT AMONG AGES 16 TO 19 YEARS
0.0/ 100
METRIC RATING
278th/ 347
METRIC RANK
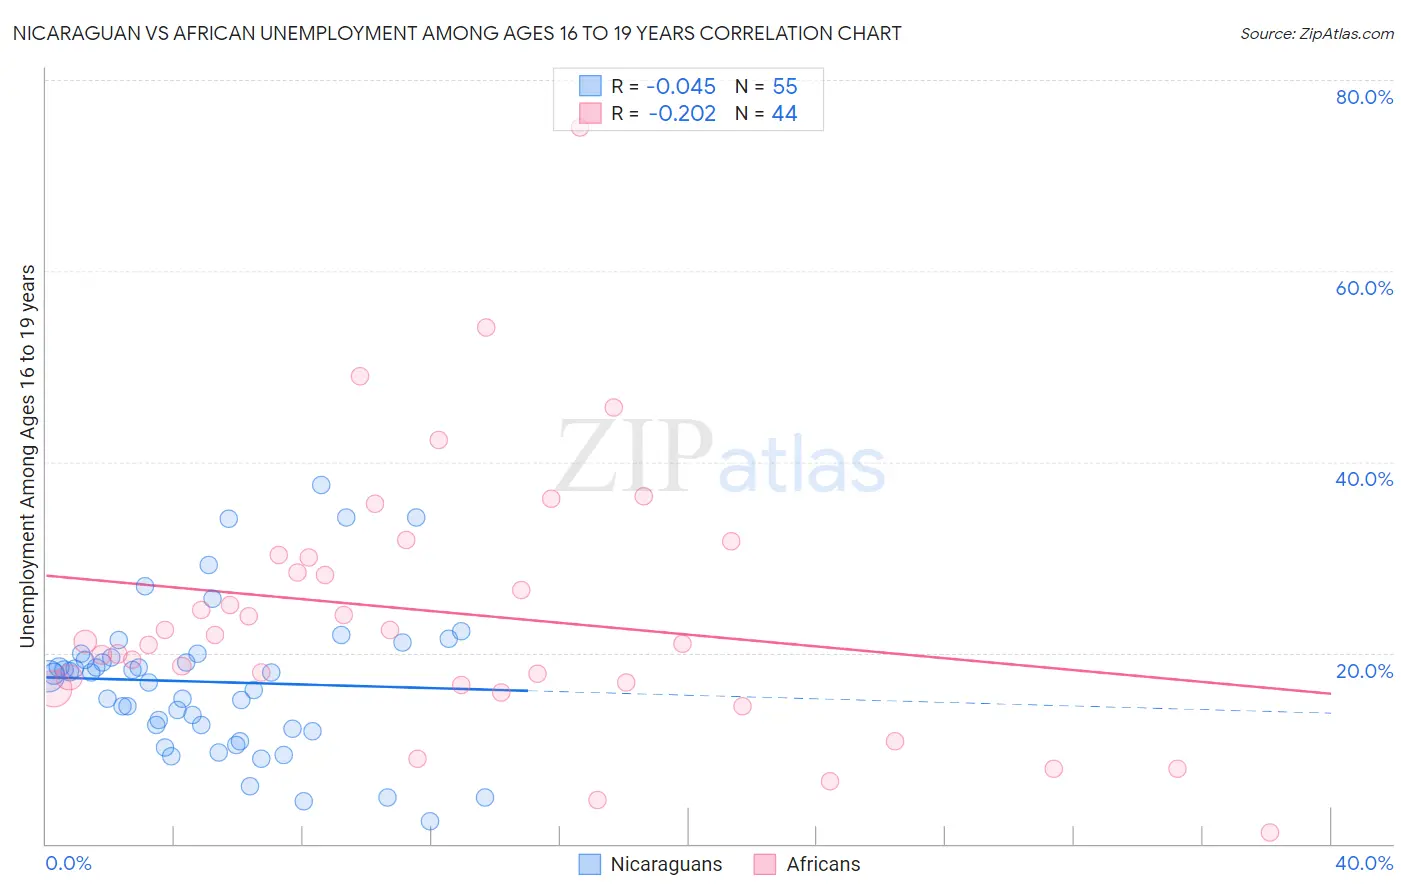
Nicaraguan vs African Unemployment Among Ages 16 to 19 years Correlation Chart
The statistical analysis conducted on geographies consisting of 277,140,556 people shows no correlation between the proportion of Nicaraguans and unemployment rate among population between the ages 16 and 19 in the United States with a correlation coefficient (R) of -0.045 and weighted average of 17.6%. Similarly, the statistical analysis conducted on geographies consisting of 442,505,676 people shows a weak negative correlation between the proportion of Africans and unemployment rate among population between the ages 16 and 19 in the United States with a correlation coefficient (R) of -0.202 and weighted average of 19.5%, a difference of 10.8%.
Unemployment Among Ages 16 to 19 years Correlation Summary
| Measurement | Nicaraguan | African |
| Minimum | 2.4% | 1.2% |
| Maximum | 37.6% | 75.0% |
| Range | 35.2% | 73.8% |
| Mean | 17.0% | 24.2% |
| Median | 17.8% | 21.5% |
| Interquartile 25% (IQ1) | 12.0% | 16.7% |
| Interquartile 75% (IQ3) | 19.9% | 30.1% |
| Interquartile Range (IQR) | 7.9% | 13.4% |
| Standard Deviation (Sample) | 7.6% | 13.9% |
| Standard Deviation (Population) | 7.5% | 13.7% |
Similar Demographics by Unemployment Among Ages 16 to 19 years
Demographics Similar to Nicaraguans by Unemployment Among Ages 16 to 19 years
In terms of unemployment among ages 16 to 19 years, the demographic groups most similar to Nicaraguans are Immigrants from Sweden (17.6%, a difference of 0.010%), Bermudan (17.6%, a difference of 0.010%), Celtic (17.6%, a difference of 0.010%), Osage (17.6%, a difference of 0.050%), and American (17.6%, a difference of 0.070%).
| Demographics | Rating | Rank | Unemployment Among Ages 16 to 19 years |
| Immigrants | Cambodia | 54.5 /100 | #169 | Average 17.5% |
| Immigrants | Romania | 53.3 /100 | #170 | Average 17.5% |
| Immigrants | Switzerland | 53.2 /100 | #171 | Average 17.5% |
| Immigrants | Western Europe | 52.2 /100 | #172 | Average 17.6% |
| Chileans | 50.8 /100 | #173 | Average 17.6% |
| Osage | 50.0 /100 | #174 | Average 17.6% |
| Immigrants | Sweden | 49.1 /100 | #175 | Average 17.6% |
| Nicaraguans | 48.9 /100 | #176 | Average 17.6% |
| Bermudans | 48.7 /100 | #177 | Average 17.6% |
| Celtics | 48.7 /100 | #178 | Average 17.6% |
| Americans | 47.4 /100 | #179 | Average 17.6% |
| Spaniards | 47.1 /100 | #180 | Average 17.6% |
| Immigrants | Turkey | 45.6 /100 | #181 | Average 17.6% |
| Russians | 45.2 /100 | #182 | Average 17.6% |
| Immigrants | Uruguay | 44.6 /100 | #183 | Average 17.6% |
Demographics Similar to Africans by Unemployment Among Ages 16 to 19 years
In terms of unemployment among ages 16 to 19 years, the demographic groups most similar to Africans are Immigrants from Western Africa (19.4%, a difference of 0.23%), Ute (19.6%, a difference of 0.37%), Cajun (19.6%, a difference of 0.49%), Immigrants from Latin America (19.4%, a difference of 0.56%), and Paraguayan (19.4%, a difference of 0.65%).
| Demographics | Rating | Rank | Unemployment Among Ages 16 to 19 years |
| Blackfeet | 0.0 /100 | #271 | Tragic 19.2% |
| Hispanics or Latinos | 0.0 /100 | #272 | Tragic 19.2% |
| Immigrants | Panama | 0.0 /100 | #273 | Tragic 19.3% |
| Shoshone | 0.0 /100 | #274 | Tragic 19.3% |
| Paraguayans | 0.0 /100 | #275 | Tragic 19.4% |
| Immigrants | Latin America | 0.0 /100 | #276 | Tragic 19.4% |
| Immigrants | Western Africa | 0.0 /100 | #277 | Tragic 19.4% |
| Africans | 0.0 /100 | #278 | Tragic 19.5% |
| Ute | 0.0 /100 | #279 | Tragic 19.6% |
| Cajuns | 0.0 /100 | #280 | Tragic 19.6% |
| Cypriots | 0.0 /100 | #281 | Tragic 19.6% |
| Dutch West Indians | 0.0 /100 | #282 | Tragic 19.7% |
| Sioux | 0.0 /100 | #283 | Tragic 19.7% |
| Sierra Leoneans | 0.0 /100 | #284 | Tragic 19.7% |
| Ghanaians | 0.0 /100 | #285 | Tragic 19.8% |