Ethiopian vs African Male Poverty
COMPARE
Ethiopian
African
Male Poverty
Male Poverty Comparison
Ethiopians
Africans
11.1%
MALE POVERTY
56.7/ 100
METRIC RATING
164th/ 347
METRIC RANK
14.2%
MALE POVERTY
0.0/ 100
METRIC RATING
308th/ 347
METRIC RANK
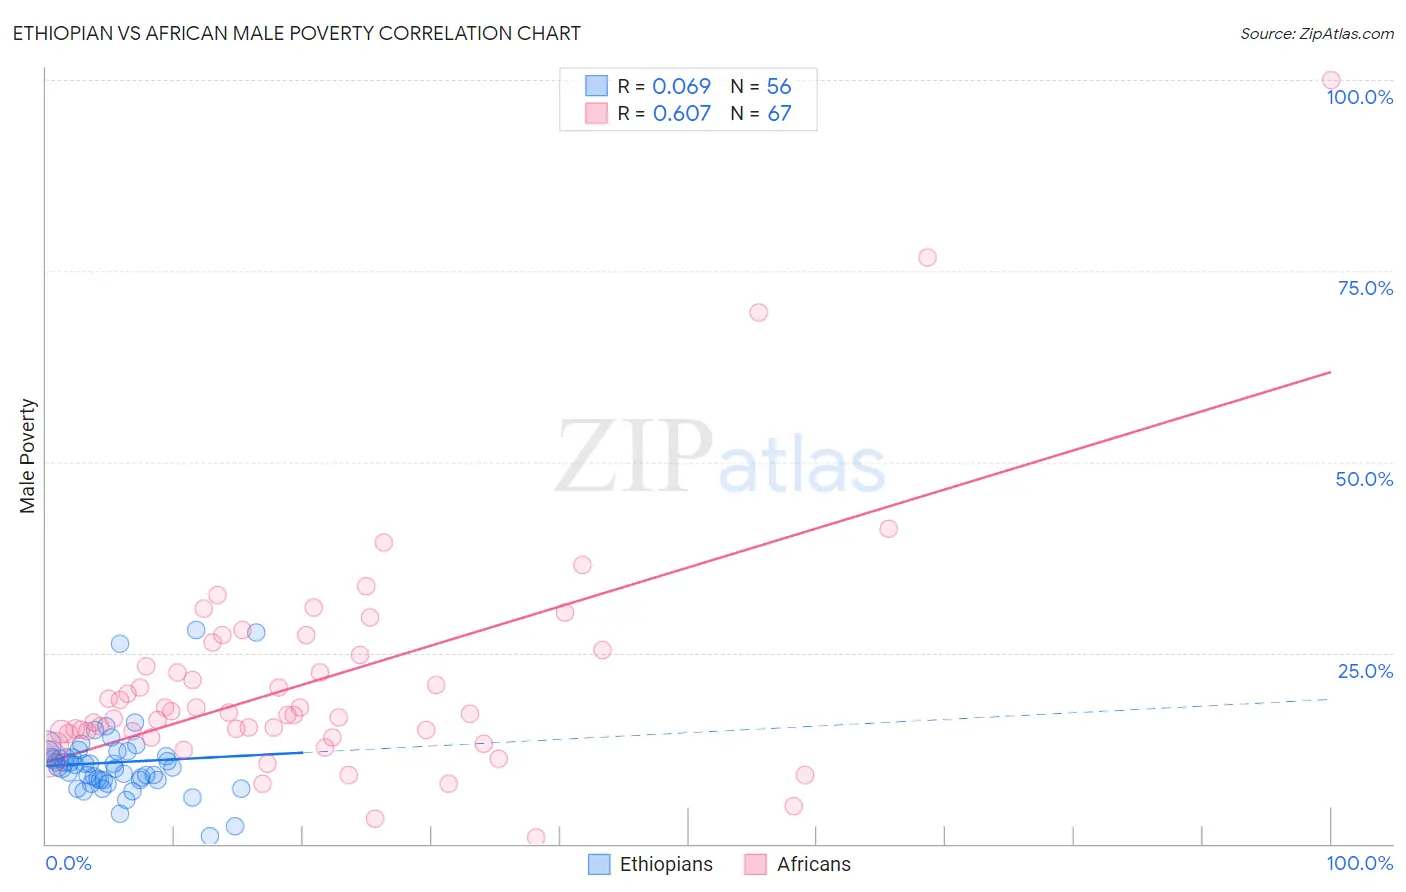
Ethiopian vs African Male Poverty Correlation Chart
The statistical analysis conducted on geographies consisting of 223,096,222 people shows a slight positive correlation between the proportion of Ethiopians and poverty level among males in the United States with a correlation coefficient (R) of 0.069 and weighted average of 11.1%. Similarly, the statistical analysis conducted on geographies consisting of 469,483,422 people shows a significant positive correlation between the proportion of Africans and poverty level among males in the United States with a correlation coefficient (R) of 0.607 and weighted average of 14.2%, a difference of 27.9%.
Male Poverty Correlation Summary
| Measurement | Ethiopian | African |
| Minimum | 1.0% | 0.81% |
| Maximum | 28.0% | 100.0% |
| Range | 27.0% | 99.2% |
| Mean | 10.6% | 21.5% |
| Median | 10.2% | 17.0% |
| Interquartile 25% (IQ1) | 8.3% | 14.4% |
| Interquartile 75% (IQ3) | 11.8% | 25.4% |
| Interquartile Range (IQR) | 3.5% | 10.9% |
| Standard Deviation (Sample) | 4.9% | 15.8% |
| Standard Deviation (Population) | 4.9% | 15.7% |
Similar Demographics by Male Poverty
Demographics Similar to Ethiopians by Male Poverty
In terms of male poverty, the demographic groups most similar to Ethiopians are White/Caucasian (11.1%, a difference of 0.010%), Immigrants from Chile (11.1%, a difference of 0.070%), Immigrants from Spain (11.1%, a difference of 0.12%), Immigrants from Albania (11.1%, a difference of 0.14%), and Hungarian (11.1%, a difference of 0.16%).
| Demographics | Rating | Rank | Male Poverty |
| Scotch-Irish | 63.7 /100 | #157 | Good 11.0% |
| Colombians | 63.0 /100 | #158 | Good 11.0% |
| Taiwanese | 62.7 /100 | #159 | Good 11.0% |
| Soviet Union | 60.3 /100 | #160 | Good 11.1% |
| Immigrants | Northern Africa | 59.7 /100 | #161 | Average 11.1% |
| Immigrants | Chile | 57.4 /100 | #162 | Average 11.1% |
| Whites/Caucasians | 56.7 /100 | #163 | Average 11.1% |
| Ethiopians | 56.7 /100 | #164 | Average 11.1% |
| Immigrants | Spain | 55.5 /100 | #165 | Average 11.1% |
| Immigrants | Albania | 55.3 /100 | #166 | Average 11.1% |
| Hungarians | 55.1 /100 | #167 | Average 11.1% |
| Immigrants | Portugal | 54.9 /100 | #168 | Average 11.1% |
| Immigrants | Colombia | 54.2 /100 | #169 | Average 11.1% |
| South Americans | 53.8 /100 | #170 | Average 11.1% |
| Uruguayans | 51.0 /100 | #171 | Average 11.2% |
Demographics Similar to Africans by Male Poverty
In terms of male poverty, the demographic groups most similar to Africans are Dutch West Indian (14.2%, a difference of 0.020%), Somali (14.3%, a difference of 0.38%), Seminole (14.3%, a difference of 0.58%), Creek (14.1%, a difference of 0.71%), and Immigrants from Bangladesh (14.1%, a difference of 0.78%).
| Demographics | Rating | Rank | Male Poverty |
| Immigrants | Senegal | 0.0 /100 | #301 | Tragic 14.0% |
| Immigrants | Caribbean | 0.0 /100 | #302 | Tragic 14.0% |
| Bahamians | 0.0 /100 | #303 | Tragic 14.1% |
| Senegalese | 0.0 /100 | #304 | Tragic 14.1% |
| Immigrants | Bangladesh | 0.0 /100 | #305 | Tragic 14.1% |
| Creek | 0.0 /100 | #306 | Tragic 14.1% |
| Dutch West Indians | 0.0 /100 | #307 | Tragic 14.2% |
| Africans | 0.0 /100 | #308 | Tragic 14.2% |
| Somalis | 0.0 /100 | #309 | Tragic 14.3% |
| Seminole | 0.0 /100 | #310 | Tragic 14.3% |
| Hondurans | 0.0 /100 | #311 | Tragic 14.3% |
| Choctaw | 0.0 /100 | #312 | Tragic 14.4% |
| Immigrants | Somalia | 0.0 /100 | #313 | Tragic 14.6% |
| Immigrants | Honduras | 0.0 /100 | #314 | Tragic 14.6% |
| Chippewa | 0.0 /100 | #315 | Tragic 14.6% |