New Zealander vs Portuguese Child Poverty Under the Age of 16
COMPARE
New Zealander
Portuguese
Child Poverty Under the Age of 16
Child Poverty Under the Age of 16 Comparison
New Zealanders
Portuguese
15.3%
CHILD POVERTY UNDER THE AGE OF 16
86.9/ 100
METRIC RATING
140th/ 347
METRIC RANK
15.1%
CHILD POVERTY UNDER THE AGE OF 16
90.6/ 100
METRIC RATING
126th/ 347
METRIC RANK
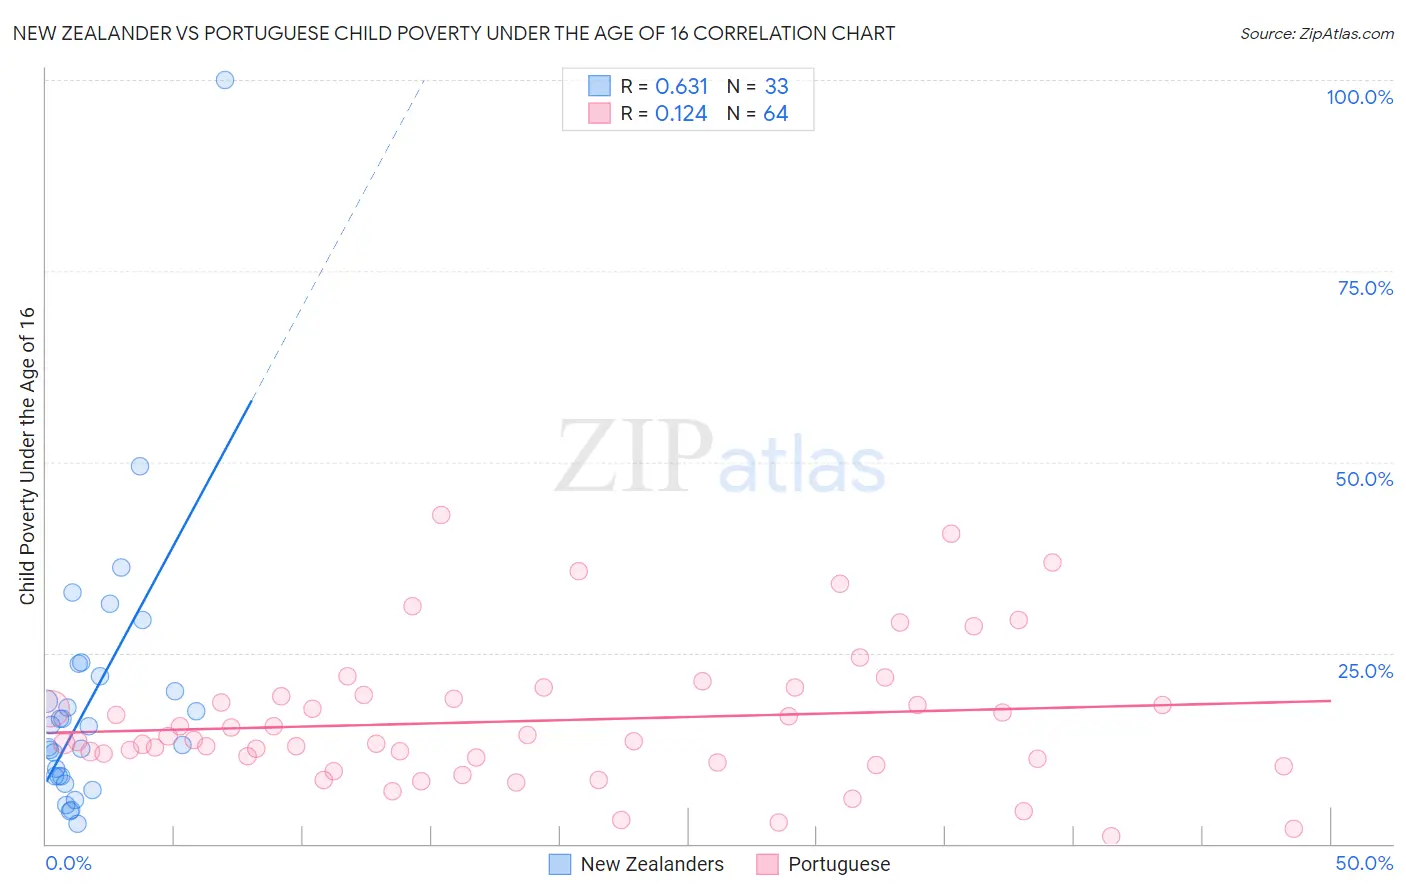
New Zealander vs Portuguese Child Poverty Under the Age of 16 Correlation Chart
The statistical analysis conducted on geographies consisting of 106,531,144 people shows a significant positive correlation between the proportion of New Zealanders and poverty level among children under the age of 16 in the United States with a correlation coefficient (R) of 0.631 and weighted average of 15.3%. Similarly, the statistical analysis conducted on geographies consisting of 444,338,613 people shows a poor positive correlation between the proportion of Portuguese and poverty level among children under the age of 16 in the United States with a correlation coefficient (R) of 0.124 and weighted average of 15.1%, a difference of 1.2%.
Child Poverty Under the Age of 16 Correlation Summary
| Measurement | New Zealander | Portuguese |
| Minimum | 2.7% | 1.0% |
| Maximum | 100.0% | 43.1% |
| Range | 97.3% | 42.1% |
| Mean | 18.9% | 16.1% |
| Median | 15.4% | 13.5% |
| Interquartile 25% (IQ1) | 8.9% | 10.9% |
| Interquartile 75% (IQ3) | 22.8% | 19.4% |
| Interquartile Range (IQR) | 13.9% | 8.5% |
| Standard Deviation (Sample) | 17.9% | 9.1% |
| Standard Deviation (Population) | 17.6% | 9.0% |
Demographics Similar to New Zealanders and Portuguese by Child Poverty Under the Age of 16
In terms of child poverty under the age of 16, the demographic groups most similar to New Zealanders are Immigrants from Vietnam (15.3%, a difference of 0.060%), Welsh (15.3%, a difference of 0.10%), Peruvian (15.3%, a difference of 0.11%), Immigrants from Spain (15.3%, a difference of 0.14%), and Albanian (15.2%, a difference of 0.51%). Similarly, the demographic groups most similar to Portuguese are Immigrants from Western Europe (15.1%, a difference of 0.090%), Palestinian (15.1%, a difference of 0.14%), Immigrants from Kazakhstan (15.1%, a difference of 0.15%), Czechoslovakian (15.1%, a difference of 0.18%), and Immigrants from Brazil (15.1%, a difference of 0.19%).
| Demographics | Rating | Rank | Child Poverty Under the Age of 16 |
| Immigrants | Brazil | 91.1 /100 | #123 | Exceptional 15.1% |
| Czechoslovakians | 91.0 /100 | #124 | Exceptional 15.1% |
| Palestinians | 90.9 /100 | #125 | Exceptional 15.1% |
| Portuguese | 90.6 /100 | #126 | Exceptional 15.1% |
| Immigrants | Western Europe | 90.3 /100 | #127 | Exceptional 15.1% |
| Immigrants | Kazakhstan | 90.2 /100 | #128 | Exceptional 15.1% |
| Immigrants | Southern Europe | 89.7 /100 | #129 | Excellent 15.1% |
| Mongolians | 89.5 /100 | #130 | Excellent 15.2% |
| Armenians | 89.4 /100 | #131 | Excellent 15.2% |
| Canadians | 89.1 /100 | #132 | Excellent 15.2% |
| Immigrants | South Eastern Asia | 89.0 /100 | #133 | Excellent 15.2% |
| Native Hawaiians | 88.7 /100 | #134 | Excellent 15.2% |
| Albanians | 88.6 /100 | #135 | Excellent 15.2% |
| Immigrants | Spain | 87.3 /100 | #136 | Excellent 15.3% |
| Peruvians | 87.2 /100 | #137 | Excellent 15.3% |
| Welsh | 87.2 /100 | #138 | Excellent 15.3% |
| Immigrants | Vietnam | 87.1 /100 | #139 | Excellent 15.3% |
| New Zealanders | 86.9 /100 | #140 | Excellent 15.3% |
| Slavs | 84.2 /100 | #141 | Excellent 15.4% |
| Brazilians | 82.8 /100 | #142 | Excellent 15.4% |
| Icelanders | 82.5 /100 | #143 | Excellent 15.4% |