New Zealander vs Immigrants from Bolivia Child Poverty Under the Age of 16
COMPARE
New Zealander
Immigrants from Bolivia
Child Poverty Under the Age of 16
Child Poverty Under the Age of 16 Comparison
New Zealanders
Immigrants from Bolivia
15.3%
CHILD POVERTY UNDER THE AGE OF 16
86.9/ 100
METRIC RATING
140th/ 347
METRIC RANK
13.6%
CHILD POVERTY UNDER THE AGE OF 16
99.6/ 100
METRIC RATING
37th/ 347
METRIC RANK
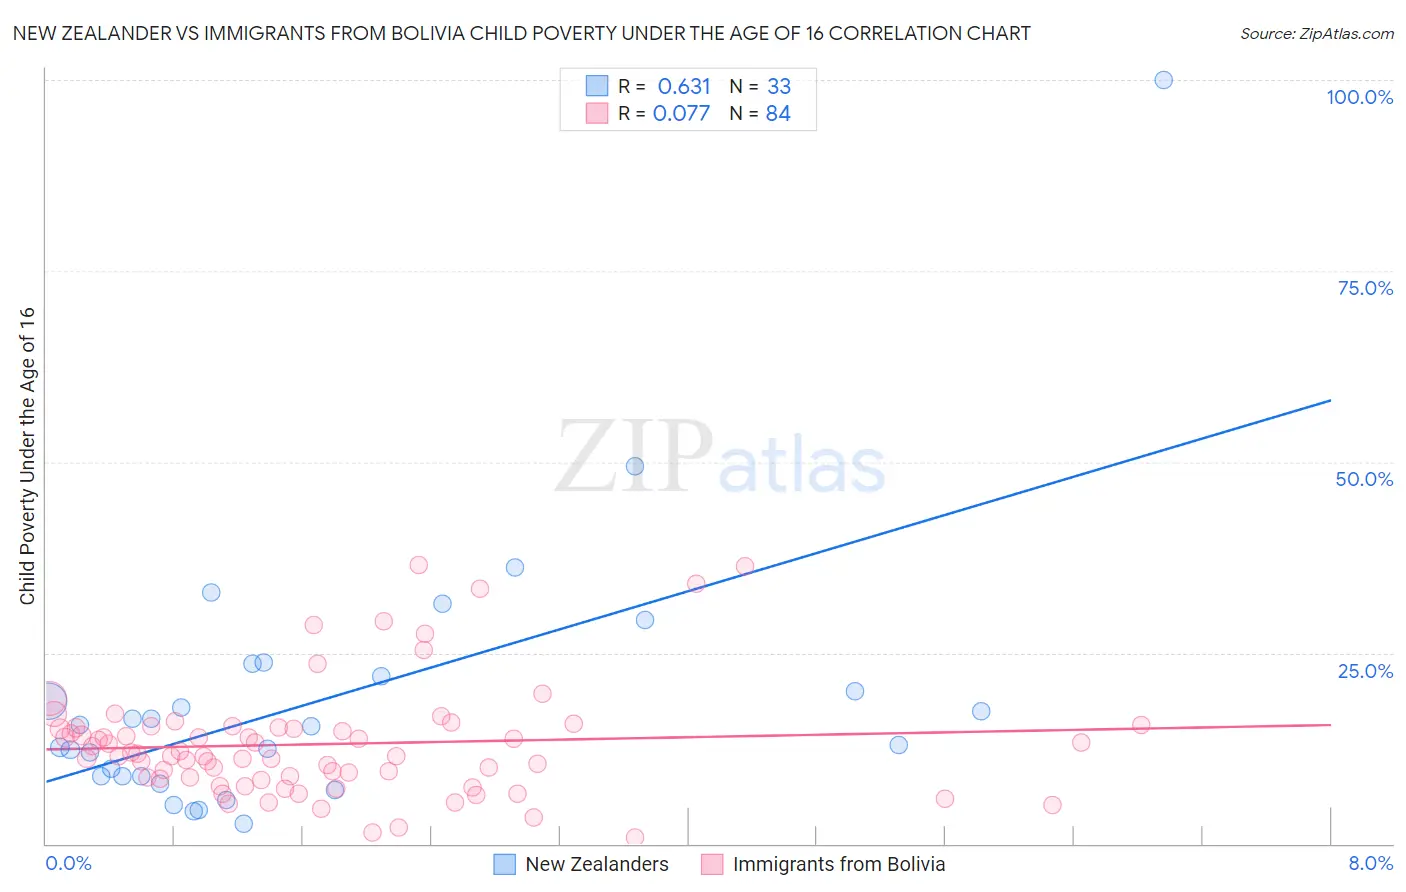
New Zealander vs Immigrants from Bolivia Child Poverty Under the Age of 16 Correlation Chart
The statistical analysis conducted on geographies consisting of 106,531,144 people shows a significant positive correlation between the proportion of New Zealanders and poverty level among children under the age of 16 in the United States with a correlation coefficient (R) of 0.631 and weighted average of 15.3%. Similarly, the statistical analysis conducted on geographies consisting of 158,228,551 people shows a slight positive correlation between the proportion of Immigrants from Bolivia and poverty level among children under the age of 16 in the United States with a correlation coefficient (R) of 0.077 and weighted average of 13.6%, a difference of 12.7%.
Child Poverty Under the Age of 16 Correlation Summary
| Measurement | New Zealander | Immigrants from Bolivia |
| Minimum | 2.7% | 0.74% |
| Maximum | 100.0% | 36.5% |
| Range | 97.3% | 35.8% |
| Mean | 18.9% | 13.1% |
| Median | 15.4% | 11.6% |
| Interquartile 25% (IQ1) | 8.9% | 8.6% |
| Interquartile 75% (IQ3) | 22.8% | 15.2% |
| Interquartile Range (IQR) | 13.9% | 6.6% |
| Standard Deviation (Sample) | 17.9% | 7.4% |
| Standard Deviation (Population) | 17.6% | 7.3% |
Similar Demographics by Child Poverty Under the Age of 16
Demographics Similar to New Zealanders by Child Poverty Under the Age of 16
In terms of child poverty under the age of 16, the demographic groups most similar to New Zealanders are Immigrants from Vietnam (15.3%, a difference of 0.060%), Welsh (15.3%, a difference of 0.10%), Peruvian (15.3%, a difference of 0.11%), Immigrants from Spain (15.3%, a difference of 0.14%), and Albanian (15.2%, a difference of 0.51%).
| Demographics | Rating | Rank | Child Poverty Under the Age of 16 |
| Immigrants | South Eastern Asia | 89.0 /100 | #133 | Excellent 15.2% |
| Native Hawaiians | 88.7 /100 | #134 | Excellent 15.2% |
| Albanians | 88.6 /100 | #135 | Excellent 15.2% |
| Immigrants | Spain | 87.3 /100 | #136 | Excellent 15.3% |
| Peruvians | 87.2 /100 | #137 | Excellent 15.3% |
| Welsh | 87.2 /100 | #138 | Excellent 15.3% |
| Immigrants | Vietnam | 87.1 /100 | #139 | Excellent 15.3% |
| New Zealanders | 86.9 /100 | #140 | Excellent 15.3% |
| Slavs | 84.2 /100 | #141 | Excellent 15.4% |
| Brazilians | 82.8 /100 | #142 | Excellent 15.4% |
| Icelanders | 82.5 /100 | #143 | Excellent 15.4% |
| Immigrants | Hungary | 81.9 /100 | #144 | Excellent 15.5% |
| Immigrants | Peru | 81.7 /100 | #145 | Excellent 15.5% |
| Slovaks | 81.4 /100 | #146 | Excellent 15.5% |
| Immigrants | Kuwait | 80.5 /100 | #147 | Excellent 15.5% |
Demographics Similar to Immigrants from Bolivia by Child Poverty Under the Age of 16
In terms of child poverty under the age of 16, the demographic groups most similar to Immigrants from Bolivia are Immigrants from Northern Europe (13.6%, a difference of 0.010%), Lithuanian (13.5%, a difference of 0.26%), Russian (13.5%, a difference of 0.46%), Luxembourger (13.6%, a difference of 0.51%), and Immigrants from Australia (13.6%, a difference of 0.54%).
| Demographics | Rating | Rank | Child Poverty Under the Age of 16 |
| Turks | 99.7 /100 | #30 | Exceptional 13.4% |
| Danes | 99.7 /100 | #31 | Exceptional 13.4% |
| Tongans | 99.7 /100 | #32 | Exceptional 13.4% |
| Asians | 99.6 /100 | #33 | Exceptional 13.5% |
| Russians | 99.6 /100 | #34 | Exceptional 13.5% |
| Lithuanians | 99.6 /100 | #35 | Exceptional 13.5% |
| Immigrants | Northern Europe | 99.6 /100 | #36 | Exceptional 13.6% |
| Immigrants | Bolivia | 99.6 /100 | #37 | Exceptional 13.6% |
| Luxembourgers | 99.5 /100 | #38 | Exceptional 13.6% |
| Immigrants | Australia | 99.5 /100 | #39 | Exceptional 13.6% |
| Immigrants | Scotland | 99.4 /100 | #40 | Exceptional 13.7% |
| Croatians | 99.4 /100 | #41 | Exceptional 13.8% |
| Immigrants | Sri Lanka | 99.3 /100 | #42 | Exceptional 13.8% |
| Immigrants | Moldova | 99.3 /100 | #43 | Exceptional 13.8% |
| Greeks | 99.3 /100 | #44 | Exceptional 13.8% |