New Zealander vs Immigrants from Panama Child Poverty Under the Age of 16
COMPARE
New Zealander
Immigrants from Panama
Child Poverty Under the Age of 16
Child Poverty Under the Age of 16 Comparison
New Zealanders
Immigrants from Panama
15.3%
CHILD POVERTY UNDER THE AGE OF 16
86.9/ 100
METRIC RATING
140th/ 347
METRIC RANK
17.7%
CHILD POVERTY UNDER THE AGE OF 16
4.1/ 100
METRIC RATING
220th/ 347
METRIC RANK
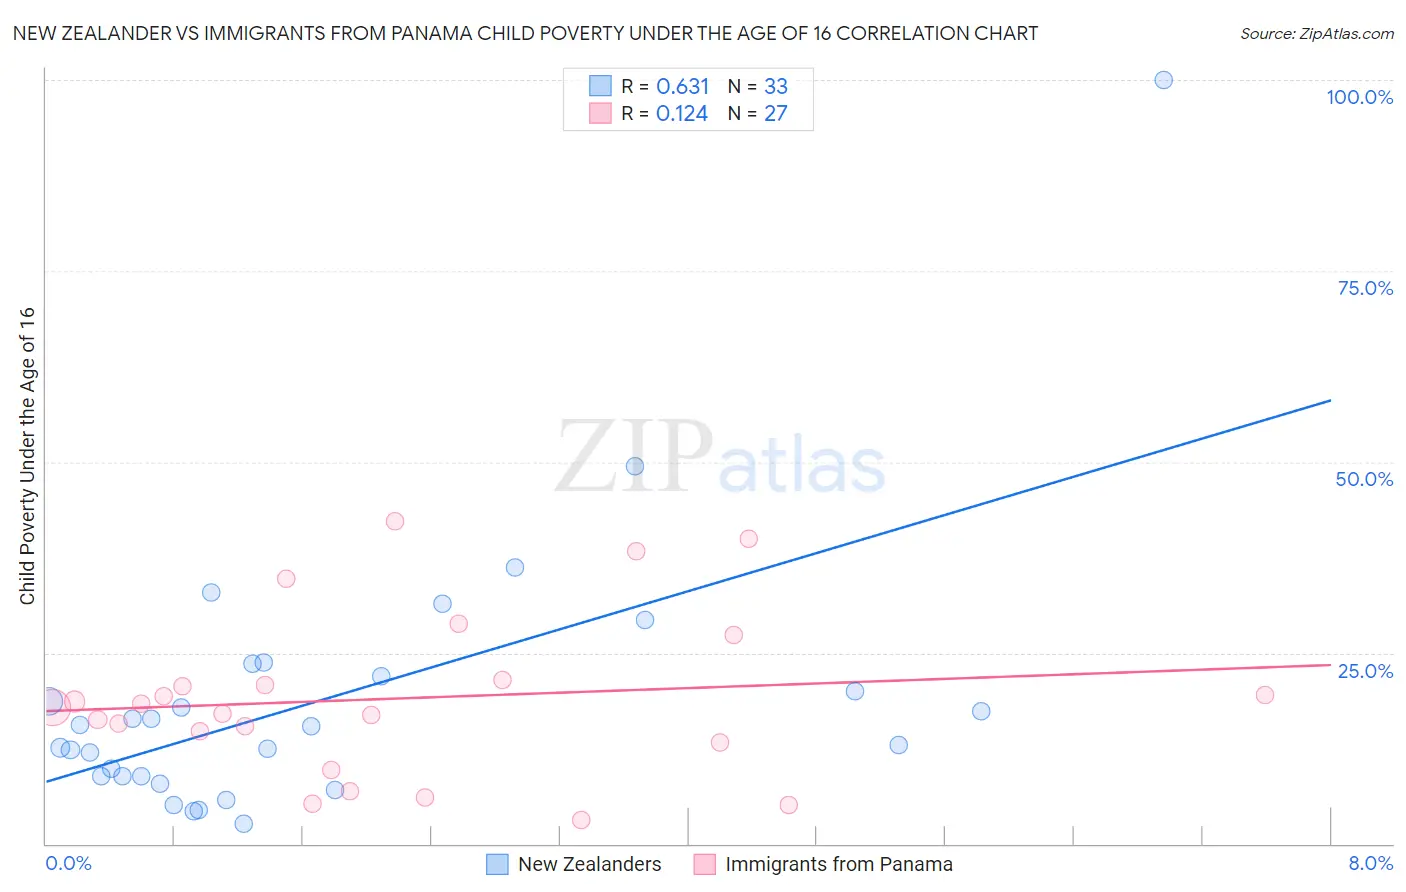
New Zealander vs Immigrants from Panama Child Poverty Under the Age of 16 Correlation Chart
The statistical analysis conducted on geographies consisting of 106,531,144 people shows a significant positive correlation between the proportion of New Zealanders and poverty level among children under the age of 16 in the United States with a correlation coefficient (R) of 0.631 and weighted average of 15.3%. Similarly, the statistical analysis conducted on geographies consisting of 220,562,489 people shows a poor positive correlation between the proportion of Immigrants from Panama and poverty level among children under the age of 16 in the United States with a correlation coefficient (R) of 0.124 and weighted average of 17.7%, a difference of 16.0%.
Child Poverty Under the Age of 16 Correlation Summary
| Measurement | New Zealander | Immigrants from Panama |
| Minimum | 2.7% | 3.1% |
| Maximum | 100.0% | 42.3% |
| Range | 97.3% | 39.2% |
| Mean | 18.9% | 19.0% |
| Median | 15.4% | 17.9% |
| Interquartile 25% (IQ1) | 8.9% | 13.3% |
| Interquartile 75% (IQ3) | 22.8% | 21.5% |
| Interquartile Range (IQR) | 13.9% | 8.2% |
| Standard Deviation (Sample) | 17.9% | 10.6% |
| Standard Deviation (Population) | 17.6% | 10.4% |
Similar Demographics by Child Poverty Under the Age of 16
Demographics Similar to New Zealanders by Child Poverty Under the Age of 16
In terms of child poverty under the age of 16, the demographic groups most similar to New Zealanders are Immigrants from Vietnam (15.3%, a difference of 0.060%), Welsh (15.3%, a difference of 0.10%), Peruvian (15.3%, a difference of 0.11%), Immigrants from Spain (15.3%, a difference of 0.14%), and Albanian (15.2%, a difference of 0.51%).
| Demographics | Rating | Rank | Child Poverty Under the Age of 16 |
| Immigrants | South Eastern Asia | 89.0 /100 | #133 | Excellent 15.2% |
| Native Hawaiians | 88.7 /100 | #134 | Excellent 15.2% |
| Albanians | 88.6 /100 | #135 | Excellent 15.2% |
| Immigrants | Spain | 87.3 /100 | #136 | Excellent 15.3% |
| Peruvians | 87.2 /100 | #137 | Excellent 15.3% |
| Welsh | 87.2 /100 | #138 | Excellent 15.3% |
| Immigrants | Vietnam | 87.1 /100 | #139 | Excellent 15.3% |
| New Zealanders | 86.9 /100 | #140 | Excellent 15.3% |
| Slavs | 84.2 /100 | #141 | Excellent 15.4% |
| Brazilians | 82.8 /100 | #142 | Excellent 15.4% |
| Icelanders | 82.5 /100 | #143 | Excellent 15.4% |
| Immigrants | Hungary | 81.9 /100 | #144 | Excellent 15.5% |
| Immigrants | Peru | 81.7 /100 | #145 | Excellent 15.5% |
| Slovaks | 81.4 /100 | #146 | Excellent 15.5% |
| Immigrants | Kuwait | 80.5 /100 | #147 | Excellent 15.5% |
Demographics Similar to Immigrants from Panama by Child Poverty Under the Age of 16
In terms of child poverty under the age of 16, the demographic groups most similar to Immigrants from Panama are Cuban (17.8%, a difference of 0.27%), Immigrants from Armenia (17.8%, a difference of 0.33%), Japanese (17.7%, a difference of 0.40%), Immigrants from Cambodia (17.8%, a difference of 0.57%), and Moroccan (17.6%, a difference of 0.77%).
| Demographics | Rating | Rank | Child Poverty Under the Age of 16 |
| Immigrants | Azores | 6.2 /100 | #213 | Tragic 17.5% |
| Iraqis | 5.9 /100 | #214 | Tragic 17.5% |
| Malaysians | 5.9 /100 | #215 | Tragic 17.5% |
| Sierra Leoneans | 5.7 /100 | #216 | Tragic 17.6% |
| Immigrants | Eastern Africa | 5.3 /100 | #217 | Tragic 17.6% |
| Moroccans | 5.3 /100 | #218 | Tragic 17.6% |
| Japanese | 4.7 /100 | #219 | Tragic 17.7% |
| Immigrants | Panama | 4.1 /100 | #220 | Tragic 17.7% |
| Cubans | 3.7 /100 | #221 | Tragic 17.8% |
| Immigrants | Armenia | 3.6 /100 | #222 | Tragic 17.8% |
| Immigrants | Cambodia | 3.3 /100 | #223 | Tragic 17.8% |
| Osage | 3.1 /100 | #224 | Tragic 17.9% |
| Immigrants | Nonimmigrants | 2.7 /100 | #225 | Tragic 17.9% |
| Bermudans | 2.6 /100 | #226 | Tragic 18.0% |
| Immigrants | Africa | 2.5 /100 | #227 | Tragic 18.0% |