New Zealander vs Portuguese Median Family Income
COMPARE
New Zealander
Portuguese
Median Family Income
Median Family Income Comparison
New Zealanders
Portuguese
$115,230
MEDIAN FAMILY INCOME
99.8/ 100
METRIC RATING
56th/ 347
METRIC RANK
$106,286
MEDIAN FAMILY INCOME
86.3/ 100
METRIC RATING
135th/ 347
METRIC RANK
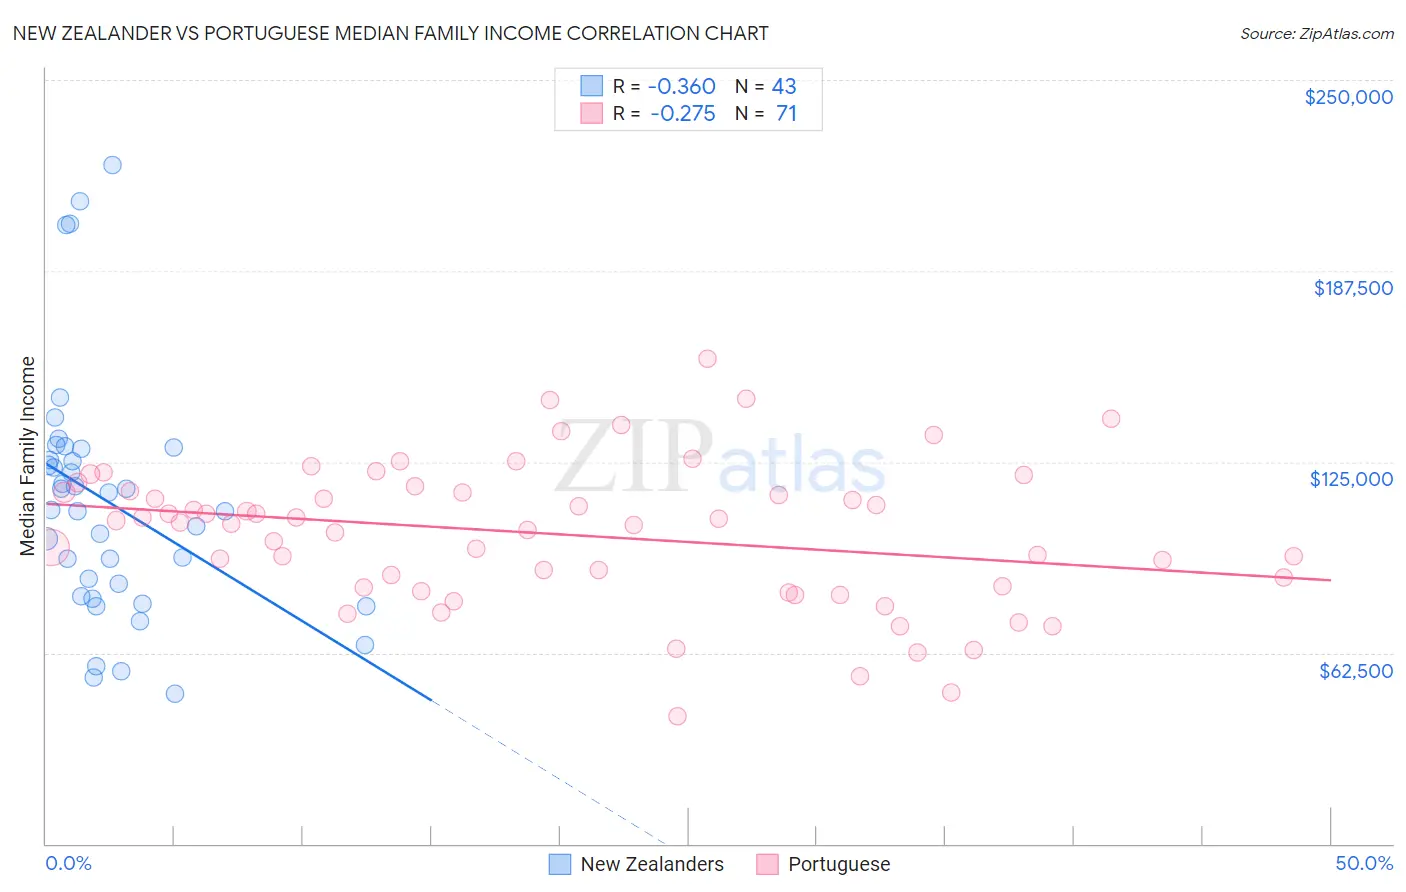
New Zealander vs Portuguese Median Family Income Correlation Chart
The statistical analysis conducted on geographies consisting of 106,887,889 people shows a mild negative correlation between the proportion of New Zealanders and median family income in the United States with a correlation coefficient (R) of -0.360 and weighted average of $115,230. Similarly, the statistical analysis conducted on geographies consisting of 449,790,054 people shows a weak negative correlation between the proportion of Portuguese and median family income in the United States with a correlation coefficient (R) of -0.275 and weighted average of $106,286, a difference of 8.4%.
Median Family Income Correlation Summary
| Measurement | New Zealander | Portuguese |
| Minimum | $49,107 | $41,875 |
| Maximum | $222,283 | $158,667 |
| Range | $173,176 | $116,792 |
| Mean | $111,963 | $101,290 |
| Median | $109,262 | $105,008 |
| Interquartile 25% (IQ1) | $80,824 | $83,759 |
| Interquartile 75% (IQ3) | $129,386 | $115,390 |
| Interquartile Range (IQR) | $48,562 | $31,631 |
| Standard Deviation (Sample) | $40,212 | $23,601 |
| Standard Deviation (Population) | $39,742 | $23,434 |
Similar Demographics by Median Family Income
Demographics Similar to New Zealanders by Median Family Income
In terms of median family income, the demographic groups most similar to New Zealanders are Greek ($115,192, a difference of 0.030%), Immigrants from Indonesia ($115,162, a difference of 0.060%), Lithuanian ($115,395, a difference of 0.14%), Immigrants from Netherlands ($114,987, a difference of 0.21%), and Immigrants from Europe ($115,523, a difference of 0.25%).
| Demographics | Rating | Rank | Median Family Income |
| Chinese | 99.9 /100 | #49 | Exceptional $116,188 |
| Immigrants | Czechoslovakia | 99.9 /100 | #50 | Exceptional $116,165 |
| Immigrants | Malaysia | 99.9 /100 | #51 | Exceptional $115,880 |
| Maltese | 99.9 /100 | #52 | Exceptional $115,862 |
| Immigrants | Norway | 99.9 /100 | #53 | Exceptional $115,847 |
| Immigrants | Europe | 99.9 /100 | #54 | Exceptional $115,523 |
| Lithuanians | 99.8 /100 | #55 | Exceptional $115,395 |
| New Zealanders | 99.8 /100 | #56 | Exceptional $115,230 |
| Greeks | 99.8 /100 | #57 | Exceptional $115,192 |
| Immigrants | Indonesia | 99.8 /100 | #58 | Exceptional $115,162 |
| Immigrants | Netherlands | 99.8 /100 | #59 | Exceptional $114,987 |
| Immigrants | Latvia | 99.8 /100 | #60 | Exceptional $114,826 |
| Immigrants | Belarus | 99.8 /100 | #61 | Exceptional $114,586 |
| Mongolians | 99.8 /100 | #62 | Exceptional $114,553 |
| Immigrants | Pakistan | 99.8 /100 | #63 | Exceptional $114,406 |
Demographics Similar to Portuguese by Median Family Income
In terms of median family income, the demographic groups most similar to Portuguese are Immigrants from South Eastern Asia ($106,252, a difference of 0.030%), Immigrants from Uganda ($106,188, a difference of 0.090%), Immigrants from Vietnam ($106,186, a difference of 0.090%), Luxembourger ($106,183, a difference of 0.10%), and Norwegian ($106,144, a difference of 0.13%).
| Demographics | Rating | Rank | Median Family Income |
| Immigrants | Ethiopia | 90.0 /100 | #128 | Excellent $106,969 |
| Arabs | 89.9 /100 | #129 | Excellent $106,952 |
| Brazilians | 89.8 /100 | #130 | Excellent $106,942 |
| Canadians | 88.1 /100 | #131 | Excellent $106,597 |
| Immigrants | Fiji | 87.8 /100 | #132 | Excellent $106,544 |
| Ugandans | 87.8 /100 | #133 | Excellent $106,541 |
| Immigrants | Oceania | 87.3 /100 | #134 | Excellent $106,453 |
| Portuguese | 86.3 /100 | #135 | Excellent $106,286 |
| Immigrants | South Eastern Asia | 86.1 /100 | #136 | Excellent $106,252 |
| Immigrants | Uganda | 85.7 /100 | #137 | Excellent $106,188 |
| Immigrants | Vietnam | 85.7 /100 | #138 | Excellent $106,186 |
| Luxembourgers | 85.7 /100 | #139 | Excellent $106,183 |
| Norwegians | 85.5 /100 | #140 | Excellent $106,144 |
| Immigrants | Syria | 85.3 /100 | #141 | Excellent $106,118 |
| Slovenes | 84.7 /100 | #142 | Excellent $106,020 |