New Zealander vs Hispanic or Latino Child Poverty Under the Age of 16
COMPARE
New Zealander
Hispanic or Latino
Child Poverty Under the Age of 16
Child Poverty Under the Age of 16 Comparison
New Zealanders
Hispanics or Latinos
15.3%
CHILD POVERTY UNDER THE AGE OF 16
86.9/ 100
METRIC RATING
140th/ 347
METRIC RANK
20.8%
CHILD POVERTY UNDER THE AGE OF 16
0.0/ 100
METRIC RATING
297th/ 347
METRIC RANK
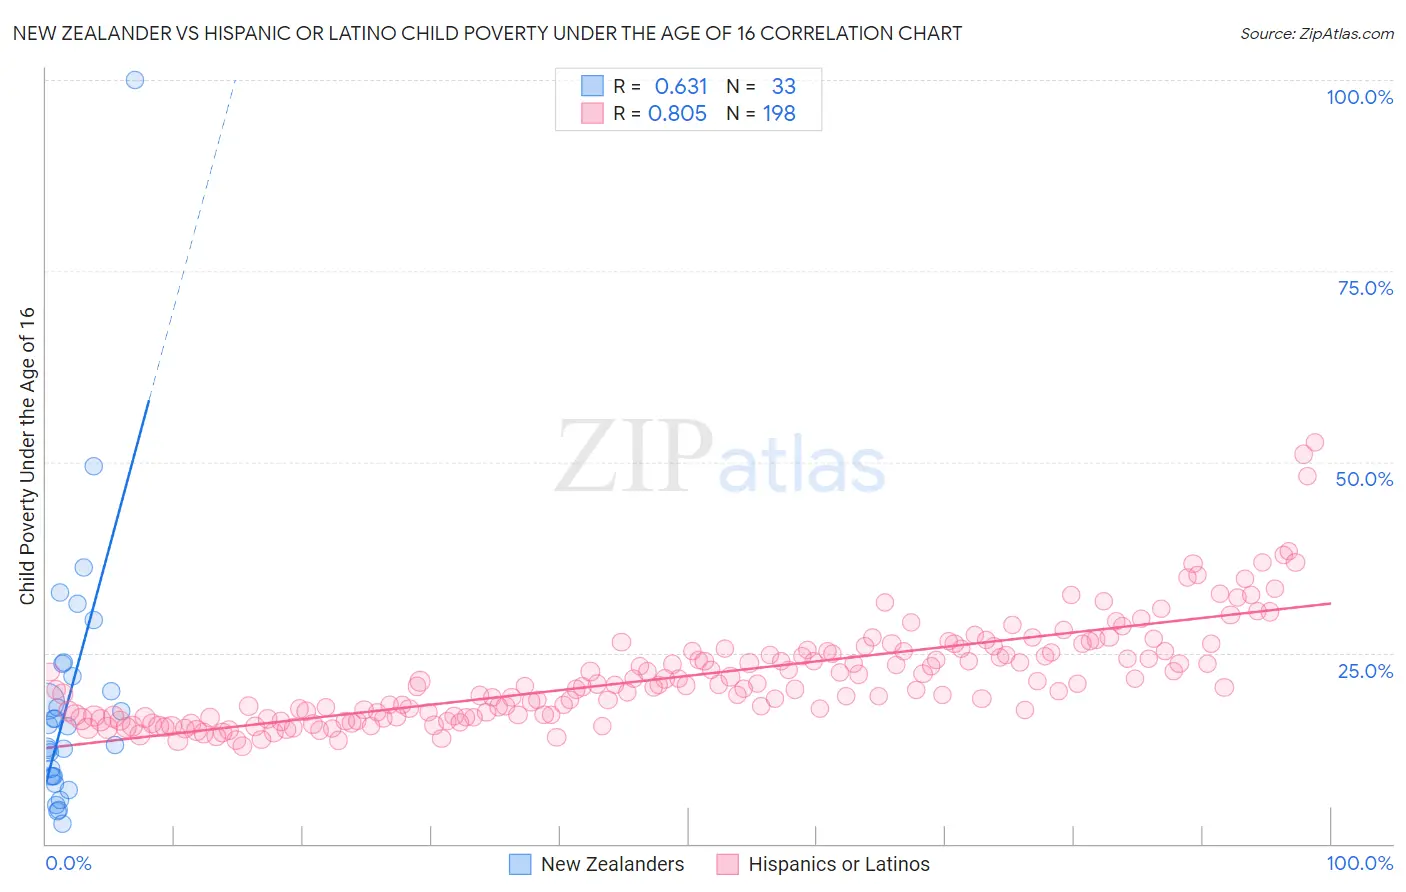
New Zealander vs Hispanic or Latino Child Poverty Under the Age of 16 Correlation Chart
The statistical analysis conducted on geographies consisting of 106,531,144 people shows a significant positive correlation between the proportion of New Zealanders and poverty level among children under the age of 16 in the United States with a correlation coefficient (R) of 0.631 and weighted average of 15.3%. Similarly, the statistical analysis conducted on geographies consisting of 562,230,949 people shows a very strong positive correlation between the proportion of Hispanics or Latinos and poverty level among children under the age of 16 in the United States with a correlation coefficient (R) of 0.805 and weighted average of 20.8%, a difference of 36.0%.
Child Poverty Under the Age of 16 Correlation Summary
| Measurement | New Zealander | Hispanic or Latino |
| Minimum | 2.7% | 12.8% |
| Maximum | 100.0% | 52.5% |
| Range | 97.3% | 39.7% |
| Mean | 18.9% | 21.9% |
| Median | 15.4% | 20.6% |
| Interquartile 25% (IQ1) | 8.9% | 16.6% |
| Interquartile 75% (IQ3) | 22.8% | 25.2% |
| Interquartile Range (IQR) | 13.9% | 8.6% |
| Standard Deviation (Sample) | 17.9% | 6.7% |
| Standard Deviation (Population) | 17.6% | 6.7% |
Similar Demographics by Child Poverty Under the Age of 16
Demographics Similar to New Zealanders by Child Poverty Under the Age of 16
In terms of child poverty under the age of 16, the demographic groups most similar to New Zealanders are Immigrants from Vietnam (15.3%, a difference of 0.060%), Welsh (15.3%, a difference of 0.10%), Peruvian (15.3%, a difference of 0.11%), Immigrants from Spain (15.3%, a difference of 0.14%), and Albanian (15.2%, a difference of 0.51%).
| Demographics | Rating | Rank | Child Poverty Under the Age of 16 |
| Immigrants | South Eastern Asia | 89.0 /100 | #133 | Excellent 15.2% |
| Native Hawaiians | 88.7 /100 | #134 | Excellent 15.2% |
| Albanians | 88.6 /100 | #135 | Excellent 15.2% |
| Immigrants | Spain | 87.3 /100 | #136 | Excellent 15.3% |
| Peruvians | 87.2 /100 | #137 | Excellent 15.3% |
| Welsh | 87.2 /100 | #138 | Excellent 15.3% |
| Immigrants | Vietnam | 87.1 /100 | #139 | Excellent 15.3% |
| New Zealanders | 86.9 /100 | #140 | Excellent 15.3% |
| Slavs | 84.2 /100 | #141 | Excellent 15.4% |
| Brazilians | 82.8 /100 | #142 | Excellent 15.4% |
| Icelanders | 82.5 /100 | #143 | Excellent 15.4% |
| Immigrants | Hungary | 81.9 /100 | #144 | Excellent 15.5% |
| Immigrants | Peru | 81.7 /100 | #145 | Excellent 15.5% |
| Slovaks | 81.4 /100 | #146 | Excellent 15.5% |
| Immigrants | Kuwait | 80.5 /100 | #147 | Excellent 15.5% |
Demographics Similar to Hispanics or Latinos by Child Poverty Under the Age of 16
In terms of child poverty under the age of 16, the demographic groups most similar to Hispanics or Latinos are Arapaho (20.8%, a difference of 0.0%), Immigrants from Caribbean (20.8%, a difference of 0.13%), Immigrants from Haiti (20.9%, a difference of 0.31%), Mexican (20.7%, a difference of 0.51%), and Haitian (20.7%, a difference of 0.65%).
| Demographics | Rating | Rank | Child Poverty Under the Age of 16 |
| Yaqui | 0.0 /100 | #290 | Tragic 20.4% |
| Chippewa | 0.0 /100 | #291 | Tragic 20.5% |
| Immigrants | Latin America | 0.0 /100 | #292 | Tragic 20.5% |
| Immigrants | Senegal | 0.0 /100 | #293 | Tragic 20.6% |
| Haitians | 0.0 /100 | #294 | Tragic 20.7% |
| Mexicans | 0.0 /100 | #295 | Tragic 20.7% |
| Immigrants | Caribbean | 0.0 /100 | #296 | Tragic 20.8% |
| Hispanics or Latinos | 0.0 /100 | #297 | Tragic 20.8% |
| Arapaho | 0.0 /100 | #298 | Tragic 20.8% |
| Immigrants | Haiti | 0.0 /100 | #299 | Tragic 20.9% |
| Indonesians | 0.0 /100 | #300 | Tragic 21.0% |
| Immigrants | Grenada | 0.0 /100 | #301 | Tragic 21.0% |
| Immigrants | Bahamas | 0.0 /100 | #302 | Tragic 21.0% |
| Choctaw | 0.0 /100 | #303 | Tragic 21.0% |
| Somalis | 0.0 /100 | #304 | Tragic 21.0% |