Nepalese vs Immigrants from Venezuela Female Poverty Among 18-24 Year Olds
COMPARE
Nepalese
Immigrants from Venezuela
Female Poverty Among 18-24 Year Olds
Female Poverty Among 18-24 Year Olds Comparison
Nepalese
Immigrants from Venezuela
20.2%
FEMALE POVERTY AMONG 18-24 YEAR OLDS
39.7/ 100
METRIC RATING
185th/ 347
METRIC RANK
17.4%
FEMALE POVERTY AMONG 18-24 YEAR OLDS
100.0/ 100
METRIC RATING
20th/ 347
METRIC RANK
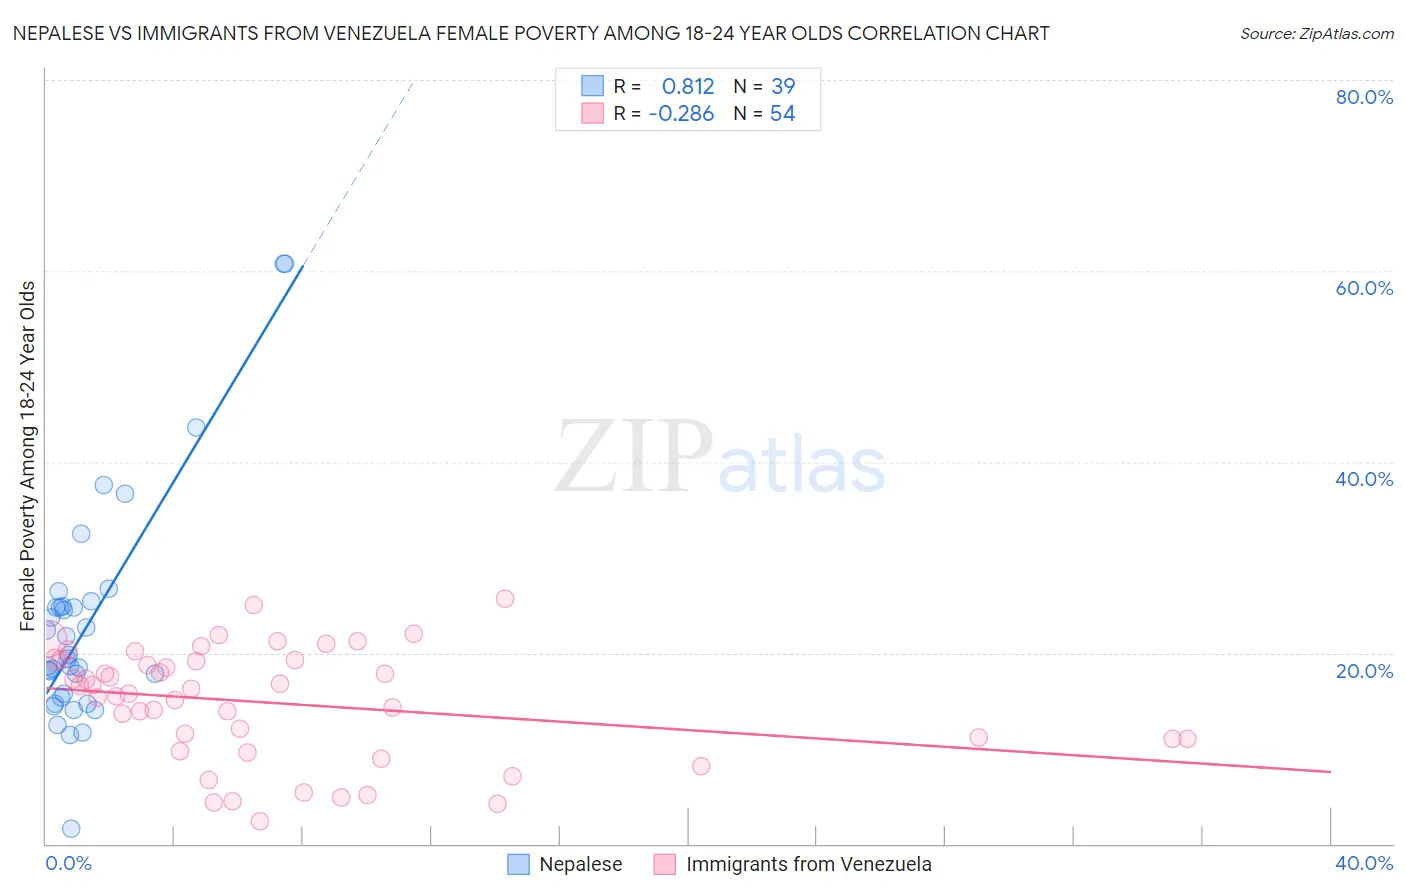
Nepalese vs Immigrants from Venezuela Female Poverty Among 18-24 Year Olds Correlation Chart
The statistical analysis conducted on geographies consisting of 24,489,423 people shows a very strong positive correlation between the proportion of Nepalese and poverty level among females between the ages 18 and 24 in the United States with a correlation coefficient (R) of 0.812 and weighted average of 20.2%. Similarly, the statistical analysis conducted on geographies consisting of 283,767,433 people shows a weak negative correlation between the proportion of Immigrants from Venezuela and poverty level among females between the ages 18 and 24 in the United States with a correlation coefficient (R) of -0.286 and weighted average of 17.4%, a difference of 15.9%.
Female Poverty Among 18-24 Year Olds Correlation Summary
| Measurement | Nepalese | Immigrants from Venezuela |
| Minimum | 1.6% | 2.4% |
| Maximum | 60.7% | 25.7% |
| Range | 59.1% | 23.3% |
| Mean | 22.8% | 14.7% |
| Median | 19.4% | 16.0% |
| Interquartile 25% (IQ1) | 15.3% | 11.0% |
| Interquartile 75% (IQ3) | 24.9% | 19.2% |
| Interquartile Range (IQR) | 9.6% | 8.2% |
| Standard Deviation (Sample) | 11.9% | 5.9% |
| Standard Deviation (Population) | 11.7% | 5.8% |
Similar Demographics by Female Poverty Among 18-24 Year Olds
Demographics Similar to Nepalese by Female Poverty Among 18-24 Year Olds
In terms of female poverty among 18-24 year olds, the demographic groups most similar to Nepalese are Immigrants from Central America (20.2%, a difference of 0.010%), Lebanese (20.2%, a difference of 0.040%), Immigrants from Ethiopia (20.2%, a difference of 0.12%), Immigrants from China (20.2%, a difference of 0.16%), and Immigrants from Barbados (20.2%, a difference of 0.16%).
| Demographics | Rating | Rank | Female Poverty Among 18-24 Year Olds |
| Swiss | 44.0 /100 | #178 | Average 20.2% |
| Ethiopians | 43.8 /100 | #179 | Average 20.2% |
| Iraqis | 43.3 /100 | #180 | Average 20.2% |
| Immigrants | China | 43.0 /100 | #181 | Average 20.2% |
| Immigrants | Barbados | 42.8 /100 | #182 | Average 20.2% |
| Lebanese | 40.6 /100 | #183 | Average 20.2% |
| Immigrants | Central America | 39.9 /100 | #184 | Fair 20.2% |
| Nepalese | 39.7 /100 | #185 | Fair 20.2% |
| Immigrants | Ethiopia | 37.3 /100 | #186 | Fair 20.2% |
| Immigrants | Mexico | 36.3 /100 | #187 | Fair 20.2% |
| Scandinavians | 34.6 /100 | #188 | Fair 20.3% |
| Immigrants | Germany | 34.0 /100 | #189 | Fair 20.3% |
| Immigrants | Western Asia | 29.3 /100 | #190 | Fair 20.3% |
| Moroccans | 25.8 /100 | #191 | Fair 20.4% |
| Immigrants | Israel | 24.4 /100 | #192 | Fair 20.4% |
Demographics Similar to Immigrants from Venezuela by Female Poverty Among 18-24 Year Olds
In terms of female poverty among 18-24 year olds, the demographic groups most similar to Immigrants from Venezuela are Bolivian (17.4%, a difference of 0.0%), Immigrants from Hong Kong (17.5%, a difference of 0.10%), Immigrants from Lithuania (17.4%, a difference of 0.13%), Immigrants from Colombia (17.3%, a difference of 0.54%), and Immigrants from North Macedonia (17.6%, a difference of 0.67%).
| Demographics | Rating | Rank | Female Poverty Among 18-24 Year Olds |
| Immigrants | Poland | 100.0 /100 | #13 | Exceptional 17.1% |
| Tongans | 100.0 /100 | #14 | Exceptional 17.1% |
| Cubans | 100.0 /100 | #15 | Exceptional 17.2% |
| Peruvians | 100.0 /100 | #16 | Exceptional 17.2% |
| Immigrants | Taiwan | 100.0 /100 | #17 | Exceptional 17.3% |
| Immigrants | Colombia | 100.0 /100 | #18 | Exceptional 17.3% |
| Immigrants | Lithuania | 100.0 /100 | #19 | Exceptional 17.4% |
| Immigrants | Venezuela | 100.0 /100 | #20 | Exceptional 17.4% |
| Bolivians | 100.0 /100 | #21 | Exceptional 17.4% |
| Immigrants | Hong Kong | 100.0 /100 | #22 | Exceptional 17.5% |
| Immigrants | North Macedonia | 100.0 /100 | #23 | Exceptional 17.6% |
| Maltese | 100.0 /100 | #24 | Exceptional 17.6% |
| Immigrants | South Central Asia | 100.0 /100 | #25 | Exceptional 17.6% |
| Immigrants | Fiji | 100.0 /100 | #26 | Exceptional 17.7% |
| Colombians | 100.0 /100 | #27 | Exceptional 17.7% |