Nepalese vs Immigrants from Ireland Female Poverty Among 18-24 Year Olds
COMPARE
Nepalese
Immigrants from Ireland
Female Poverty Among 18-24 Year Olds
Female Poverty Among 18-24 Year Olds Comparison
Nepalese
Immigrants from Ireland
20.2%
FEMALE POVERTY AMONG 18-24 YEAR OLDS
39.7/ 100
METRIC RATING
185th/ 347
METRIC RANK
18.3%
FEMALE POVERTY AMONG 18-24 YEAR OLDS
99.9/ 100
METRIC RATING
52nd/ 347
METRIC RANK
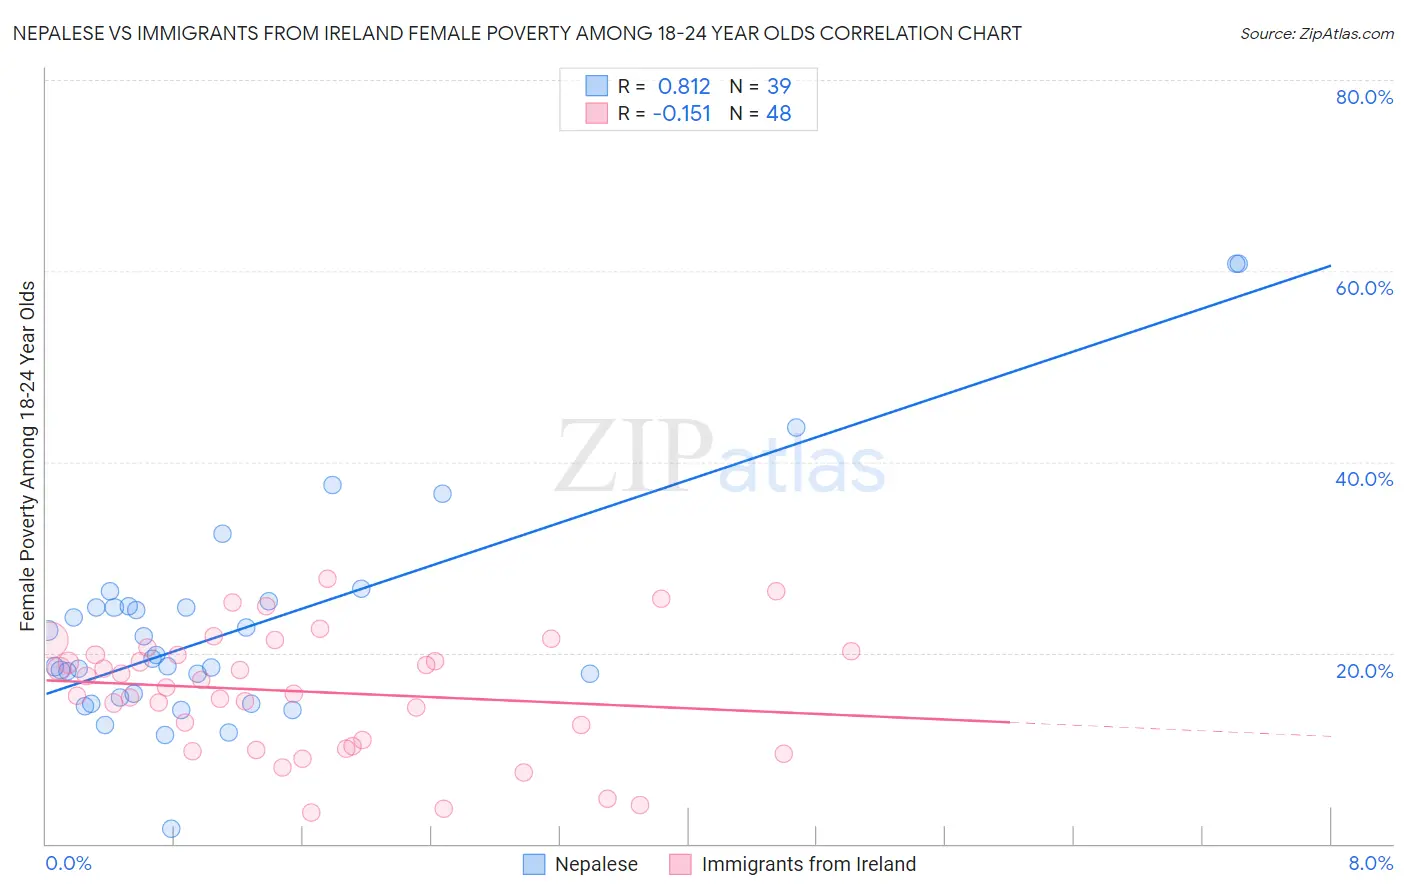
Nepalese vs Immigrants from Ireland Female Poverty Among 18-24 Year Olds Correlation Chart
The statistical analysis conducted on geographies consisting of 24,489,423 people shows a very strong positive correlation between the proportion of Nepalese and poverty level among females between the ages 18 and 24 in the United States with a correlation coefficient (R) of 0.812 and weighted average of 20.2%. Similarly, the statistical analysis conducted on geographies consisting of 234,757,176 people shows a poor negative correlation between the proportion of Immigrants from Ireland and poverty level among females between the ages 18 and 24 in the United States with a correlation coefficient (R) of -0.151 and weighted average of 18.3%, a difference of 10.3%.
Female Poverty Among 18-24 Year Olds Correlation Summary
| Measurement | Nepalese | Immigrants from Ireland |
| Minimum | 1.6% | 3.3% |
| Maximum | 60.7% | 27.7% |
| Range | 59.1% | 24.4% |
| Mean | 22.8% | 15.9% |
| Median | 19.4% | 16.8% |
| Interquartile 25% (IQ1) | 15.3% | 10.5% |
| Interquartile 75% (IQ3) | 24.9% | 20.0% |
| Interquartile Range (IQR) | 9.6% | 9.4% |
| Standard Deviation (Sample) | 11.9% | 6.2% |
| Standard Deviation (Population) | 11.7% | 6.1% |
Similar Demographics by Female Poverty Among 18-24 Year Olds
Demographics Similar to Nepalese by Female Poverty Among 18-24 Year Olds
In terms of female poverty among 18-24 year olds, the demographic groups most similar to Nepalese are Immigrants from Central America (20.2%, a difference of 0.010%), Lebanese (20.2%, a difference of 0.040%), Immigrants from Ethiopia (20.2%, a difference of 0.12%), Immigrants from China (20.2%, a difference of 0.16%), and Immigrants from Barbados (20.2%, a difference of 0.16%).
| Demographics | Rating | Rank | Female Poverty Among 18-24 Year Olds |
| Swiss | 44.0 /100 | #178 | Average 20.2% |
| Ethiopians | 43.8 /100 | #179 | Average 20.2% |
| Iraqis | 43.3 /100 | #180 | Average 20.2% |
| Immigrants | China | 43.0 /100 | #181 | Average 20.2% |
| Immigrants | Barbados | 42.8 /100 | #182 | Average 20.2% |
| Lebanese | 40.6 /100 | #183 | Average 20.2% |
| Immigrants | Central America | 39.9 /100 | #184 | Fair 20.2% |
| Nepalese | 39.7 /100 | #185 | Fair 20.2% |
| Immigrants | Ethiopia | 37.3 /100 | #186 | Fair 20.2% |
| Immigrants | Mexico | 36.3 /100 | #187 | Fair 20.2% |
| Scandinavians | 34.6 /100 | #188 | Fair 20.3% |
| Immigrants | Germany | 34.0 /100 | #189 | Fair 20.3% |
| Immigrants | Western Asia | 29.3 /100 | #190 | Fair 20.3% |
| Moroccans | 25.8 /100 | #191 | Fair 20.4% |
| Immigrants | Israel | 24.4 /100 | #192 | Fair 20.4% |
Demographics Similar to Immigrants from Ireland by Female Poverty Among 18-24 Year Olds
In terms of female poverty among 18-24 year olds, the demographic groups most similar to Immigrants from Ireland are Italian (18.3%, a difference of 0.090%), Immigrants from Egypt (18.4%, a difference of 0.32%), Albanian (18.4%, a difference of 0.32%), Argentinean (18.4%, a difference of 0.34%), and Immigrants from Eastern Europe (18.2%, a difference of 0.35%).
| Demographics | Rating | Rank | Female Poverty Among 18-24 Year Olds |
| Spanish American Indians | 100.0 /100 | #45 | Exceptional 18.1% |
| Immigrants | Southern Europe | 100.0 /100 | #46 | Exceptional 18.2% |
| Asians | 100.0 /100 | #47 | Exceptional 18.2% |
| Sri Lankans | 100.0 /100 | #48 | Exceptional 18.2% |
| Bhutanese | 100.0 /100 | #49 | Exceptional 18.2% |
| Samoans | 100.0 /100 | #50 | Exceptional 18.2% |
| Immigrants | Eastern Europe | 99.9 /100 | #51 | Exceptional 18.2% |
| Immigrants | Ireland | 99.9 /100 | #52 | Exceptional 18.3% |
| Italians | 99.9 /100 | #53 | Exceptional 18.3% |
| Immigrants | Egypt | 99.9 /100 | #54 | Exceptional 18.4% |
| Albanians | 99.9 /100 | #55 | Exceptional 18.4% |
| Argentineans | 99.9 /100 | #56 | Exceptional 18.4% |
| Immigrants | Italy | 99.9 /100 | #57 | Exceptional 18.4% |
| Immigrants | Ukraine | 99.9 /100 | #58 | Exceptional 18.4% |
| Egyptians | 99.9 /100 | #59 | Exceptional 18.5% |