Nepalese vs Native/Alaskan Female Poverty Among 18-24 Year Olds
COMPARE
Nepalese
Native/Alaskan
Female Poverty Among 18-24 Year Olds
Female Poverty Among 18-24 Year Olds Comparison
Nepalese
Natives/Alaskans
20.2%
FEMALE POVERTY AMONG 18-24 YEAR OLDS
39.7/ 100
METRIC RATING
185th/ 347
METRIC RANK
25.4%
FEMALE POVERTY AMONG 18-24 YEAR OLDS
0.0/ 100
METRIC RATING
328th/ 347
METRIC RANK
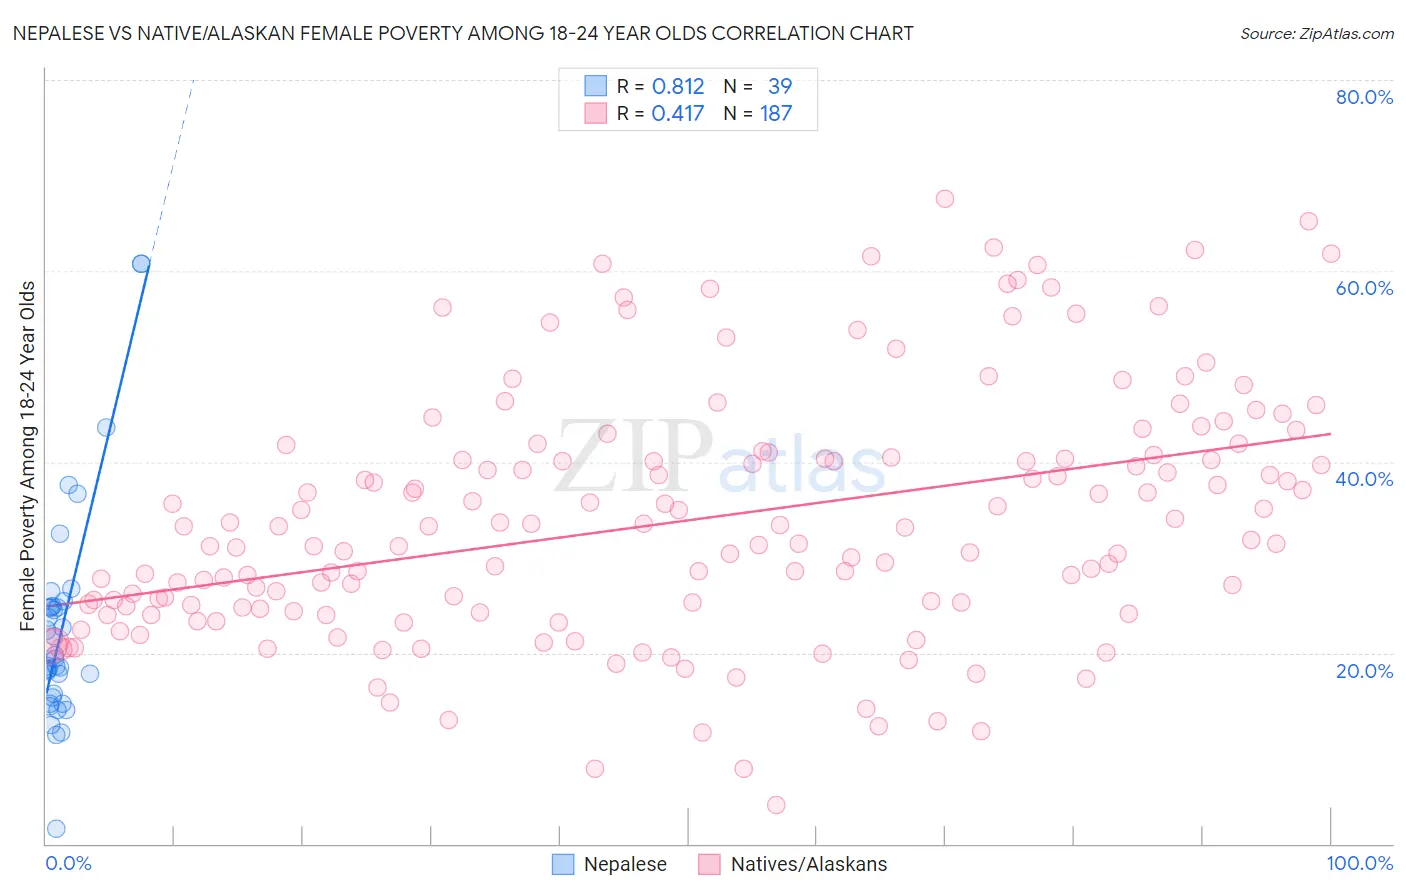
Nepalese vs Native/Alaskan Female Poverty Among 18-24 Year Olds Correlation Chart
The statistical analysis conducted on geographies consisting of 24,489,423 people shows a very strong positive correlation between the proportion of Nepalese and poverty level among females between the ages 18 and 24 in the United States with a correlation coefficient (R) of 0.812 and weighted average of 20.2%. Similarly, the statistical analysis conducted on geographies consisting of 494,517,796 people shows a moderate positive correlation between the proportion of Natives/Alaskans and poverty level among females between the ages 18 and 24 in the United States with a correlation coefficient (R) of 0.417 and weighted average of 25.4%, a difference of 25.8%.
Female Poverty Among 18-24 Year Olds Correlation Summary
| Measurement | Nepalese | Native/Alaskan |
| Minimum | 1.6% | 4.0% |
| Maximum | 60.7% | 67.6% |
| Range | 59.1% | 63.6% |
| Mean | 22.8% | 33.8% |
| Median | 19.4% | 31.8% |
| Interquartile 25% (IQ1) | 15.3% | 24.6% |
| Interquartile 75% (IQ3) | 24.9% | 40.4% |
| Interquartile Range (IQR) | 9.6% | 15.9% |
| Standard Deviation (Sample) | 11.9% | 12.9% |
| Standard Deviation (Population) | 11.7% | 12.8% |
Similar Demographics by Female Poverty Among 18-24 Year Olds
Demographics Similar to Nepalese by Female Poverty Among 18-24 Year Olds
In terms of female poverty among 18-24 year olds, the demographic groups most similar to Nepalese are Immigrants from Central America (20.2%, a difference of 0.010%), Lebanese (20.2%, a difference of 0.040%), Immigrants from Ethiopia (20.2%, a difference of 0.12%), Immigrants from China (20.2%, a difference of 0.16%), and Immigrants from Barbados (20.2%, a difference of 0.16%).
| Demographics | Rating | Rank | Female Poverty Among 18-24 Year Olds |
| Swiss | 44.0 /100 | #178 | Average 20.2% |
| Ethiopians | 43.8 /100 | #179 | Average 20.2% |
| Iraqis | 43.3 /100 | #180 | Average 20.2% |
| Immigrants | China | 43.0 /100 | #181 | Average 20.2% |
| Immigrants | Barbados | 42.8 /100 | #182 | Average 20.2% |
| Lebanese | 40.6 /100 | #183 | Average 20.2% |
| Immigrants | Central America | 39.9 /100 | #184 | Fair 20.2% |
| Nepalese | 39.7 /100 | #185 | Fair 20.2% |
| Immigrants | Ethiopia | 37.3 /100 | #186 | Fair 20.2% |
| Immigrants | Mexico | 36.3 /100 | #187 | Fair 20.2% |
| Scandinavians | 34.6 /100 | #188 | Fair 20.3% |
| Immigrants | Germany | 34.0 /100 | #189 | Fair 20.3% |
| Immigrants | Western Asia | 29.3 /100 | #190 | Fair 20.3% |
| Moroccans | 25.8 /100 | #191 | Fair 20.4% |
| Immigrants | Israel | 24.4 /100 | #192 | Fair 20.4% |
Demographics Similar to Natives/Alaskans by Female Poverty Among 18-24 Year Olds
In terms of female poverty among 18-24 year olds, the demographic groups most similar to Natives/Alaskans are Ute (25.4%, a difference of 0.050%), Yakama (25.3%, a difference of 0.29%), Immigrants from Saudi Arabia (25.3%, a difference of 0.54%), German Russian (25.2%, a difference of 0.97%), and Arapaho (25.2%, a difference of 1.0%).
| Demographics | Rating | Rank | Female Poverty Among 18-24 Year Olds |
| Immigrants | Zaire | 0.0 /100 | #321 | Tragic 25.1% |
| Somalis | 0.0 /100 | #322 | Tragic 25.1% |
| Arapaho | 0.0 /100 | #323 | Tragic 25.2% |
| German Russians | 0.0 /100 | #324 | Tragic 25.2% |
| Immigrants | Saudi Arabia | 0.0 /100 | #325 | Tragic 25.3% |
| Yakama | 0.0 /100 | #326 | Tragic 25.3% |
| Ute | 0.0 /100 | #327 | Tragic 25.4% |
| Natives/Alaskans | 0.0 /100 | #328 | Tragic 25.4% |
| Cajuns | 0.0 /100 | #329 | Tragic 25.7% |
| Immigrants | Somalia | 0.0 /100 | #330 | Tragic 25.7% |
| Chippewa | 0.0 /100 | #331 | Tragic 25.9% |
| Houma | 0.0 /100 | #332 | Tragic 26.2% |
| Apache | 0.0 /100 | #333 | Tragic 26.3% |
| Pueblo | 0.0 /100 | #334 | Tragic 26.9% |
| Yup'ik | 0.0 /100 | #335 | Tragic 27.0% |