Native/Alaskan vs Samoan Male Poverty
COMPARE
Native/Alaskan
Samoan
Male Poverty
Male Poverty Comparison
Natives/Alaskans
Samoans
16.9%
MALE POVERTY
0.0/ 100
METRIC RATING
333rd/ 347
METRIC RANK
10.9%
MALE POVERTY
71.8/ 100
METRIC RATING
144th/ 347
METRIC RANK
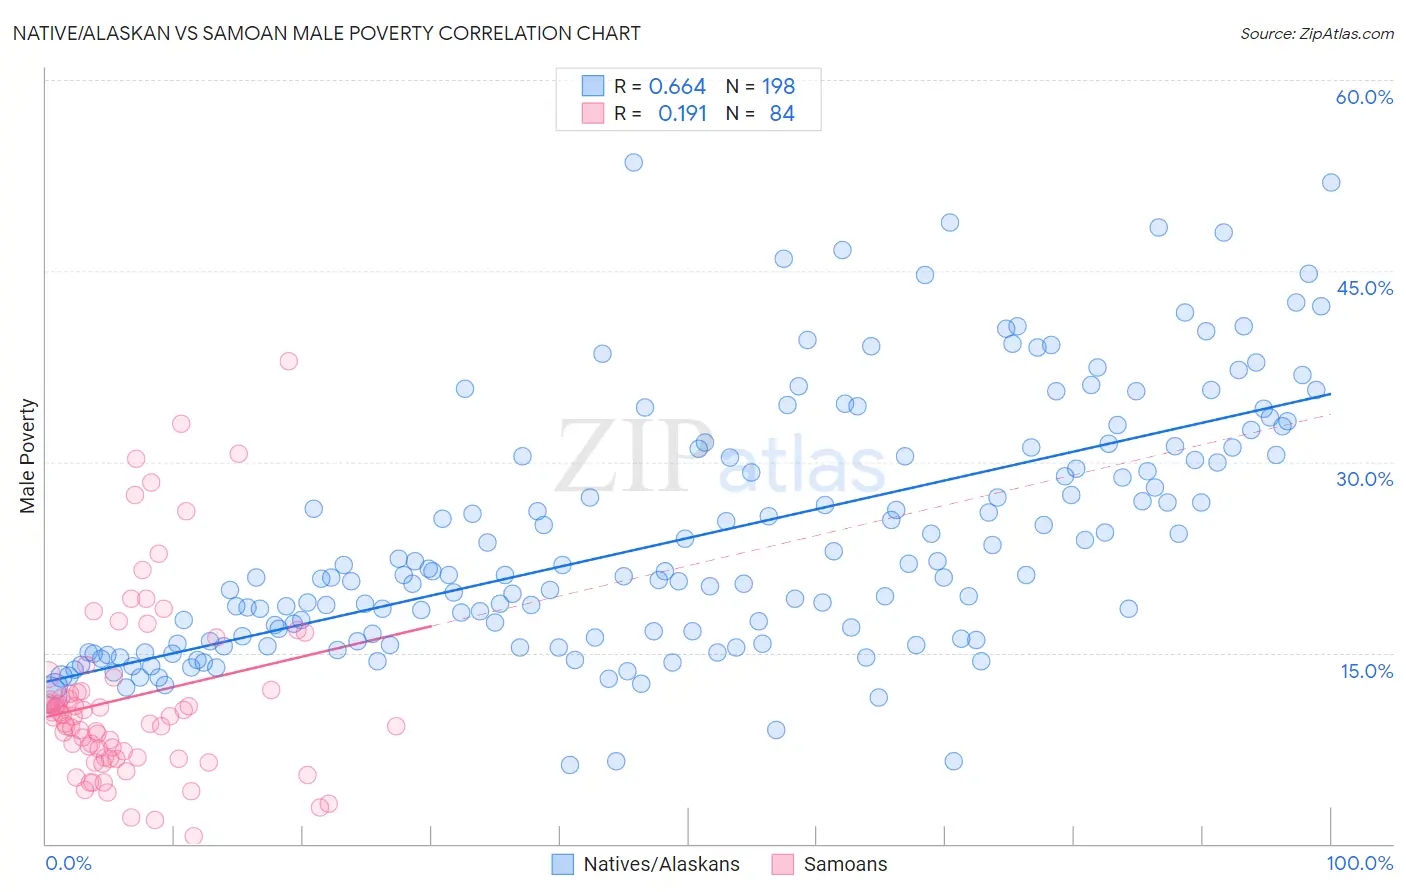
Native/Alaskan vs Samoan Male Poverty Correlation Chart
The statistical analysis conducted on geographies consisting of 512,413,000 people shows a significant positive correlation between the proportion of Natives/Alaskans and poverty level among males in the United States with a correlation coefficient (R) of 0.664 and weighted average of 16.9%. Similarly, the statistical analysis conducted on geographies consisting of 225,058,260 people shows a poor positive correlation between the proportion of Samoans and poverty level among males in the United States with a correlation coefficient (R) of 0.191 and weighted average of 10.9%, a difference of 54.8%.
Male Poverty Correlation Summary
| Measurement | Native/Alaskan | Samoan |
| Minimum | 6.2% | 0.57% |
| Maximum | 53.5% | 37.9% |
| Range | 47.3% | 37.3% |
| Mean | 24.0% | 11.5% |
| Median | 21.1% | 10.0% |
| Interquartile 25% (IQ1) | 16.0% | 6.8% |
| Interquartile 75% (IQ3) | 30.5% | 12.6% |
| Interquartile Range (IQR) | 14.6% | 5.8% |
| Standard Deviation (Sample) | 9.9% | 7.3% |
| Standard Deviation (Population) | 9.9% | 7.3% |
Similar Demographics by Male Poverty
Demographics Similar to Natives/Alaskans by Male Poverty
In terms of male poverty, the demographic groups most similar to Natives/Alaskans are Houma (16.7%, a difference of 1.2%), Cheyenne (17.6%, a difference of 4.2%), Ute (16.2%, a difference of 4.2%), Apache (17.7%, a difference of 4.4%), and Immigrants from Dominican Republic (16.2%, a difference of 4.6%).
| Demographics | Rating | Rank | Male Poverty |
| Central American Indians | 0.0 /100 | #326 | Tragic 15.3% |
| Paiute | 0.0 /100 | #327 | Tragic 15.8% |
| Blacks/African Americans | 0.0 /100 | #328 | Tragic 15.8% |
| Dominicans | 0.0 /100 | #329 | Tragic 16.1% |
| Immigrants | Dominican Republic | 0.0 /100 | #330 | Tragic 16.2% |
| Ute | 0.0 /100 | #331 | Tragic 16.2% |
| Houma | 0.0 /100 | #332 | Tragic 16.7% |
| Natives/Alaskans | 0.0 /100 | #333 | Tragic 16.9% |
| Cheyenne | 0.0 /100 | #334 | Tragic 17.6% |
| Apache | 0.0 /100 | #335 | Tragic 17.7% |
| Pueblo | 0.0 /100 | #336 | Tragic 18.5% |
| Sioux | 0.0 /100 | #337 | Tragic 18.7% |
| Crow | 0.0 /100 | #338 | Tragic 19.1% |
| Yuman | 0.0 /100 | #339 | Tragic 19.5% |
| Immigrants | Yemen | 0.0 /100 | #340 | Tragic 20.1% |
Demographics Similar to Samoans by Male Poverty
In terms of male poverty, the demographic groups most similar to Samoans are Afghan (10.9%, a difference of 0.020%), Immigrants from Germany (10.9%, a difference of 0.020%), Syrian (10.9%, a difference of 0.050%), Basque (10.9%, a difference of 0.36%), and Icelander (11.0%, a difference of 0.39%).
| Demographics | Rating | Rank | Male Poverty |
| Immigrants | Switzerland | 79.2 /100 | #137 | Good 10.8% |
| Yugoslavians | 78.2 /100 | #138 | Good 10.8% |
| Immigrants | Jordan | 77.5 /100 | #139 | Good 10.8% |
| Tlingit-Haida | 76.1 /100 | #140 | Good 10.9% |
| Immigrants | France | 75.8 /100 | #141 | Good 10.9% |
| Basques | 74.6 /100 | #142 | Good 10.9% |
| Afghans | 71.9 /100 | #143 | Good 10.9% |
| Samoans | 71.8 /100 | #144 | Good 10.9% |
| Immigrants | Germany | 71.6 /100 | #145 | Good 10.9% |
| Syrians | 71.4 /100 | #146 | Good 10.9% |
| Icelanders | 68.5 /100 | #147 | Good 11.0% |
| Armenians | 68.0 /100 | #148 | Good 11.0% |
| Immigrants | Venezuela | 67.9 /100 | #149 | Good 11.0% |
| Guamanians/Chamorros | 67.6 /100 | #150 | Good 11.0% |
| Venezuelans | 67.4 /100 | #151 | Good 11.0% |