Native/Alaskan vs Immigrants from Poland Male Poverty
COMPARE
Native/Alaskan
Immigrants from Poland
Male Poverty
Male Poverty Comparison
Natives/Alaskans
Immigrants from Poland
16.9%
MALE POVERTY
0.0/ 100
METRIC RATING
333rd/ 347
METRIC RANK
9.8%
MALE POVERTY
99.5/ 100
METRIC RATING
34th/ 347
METRIC RANK
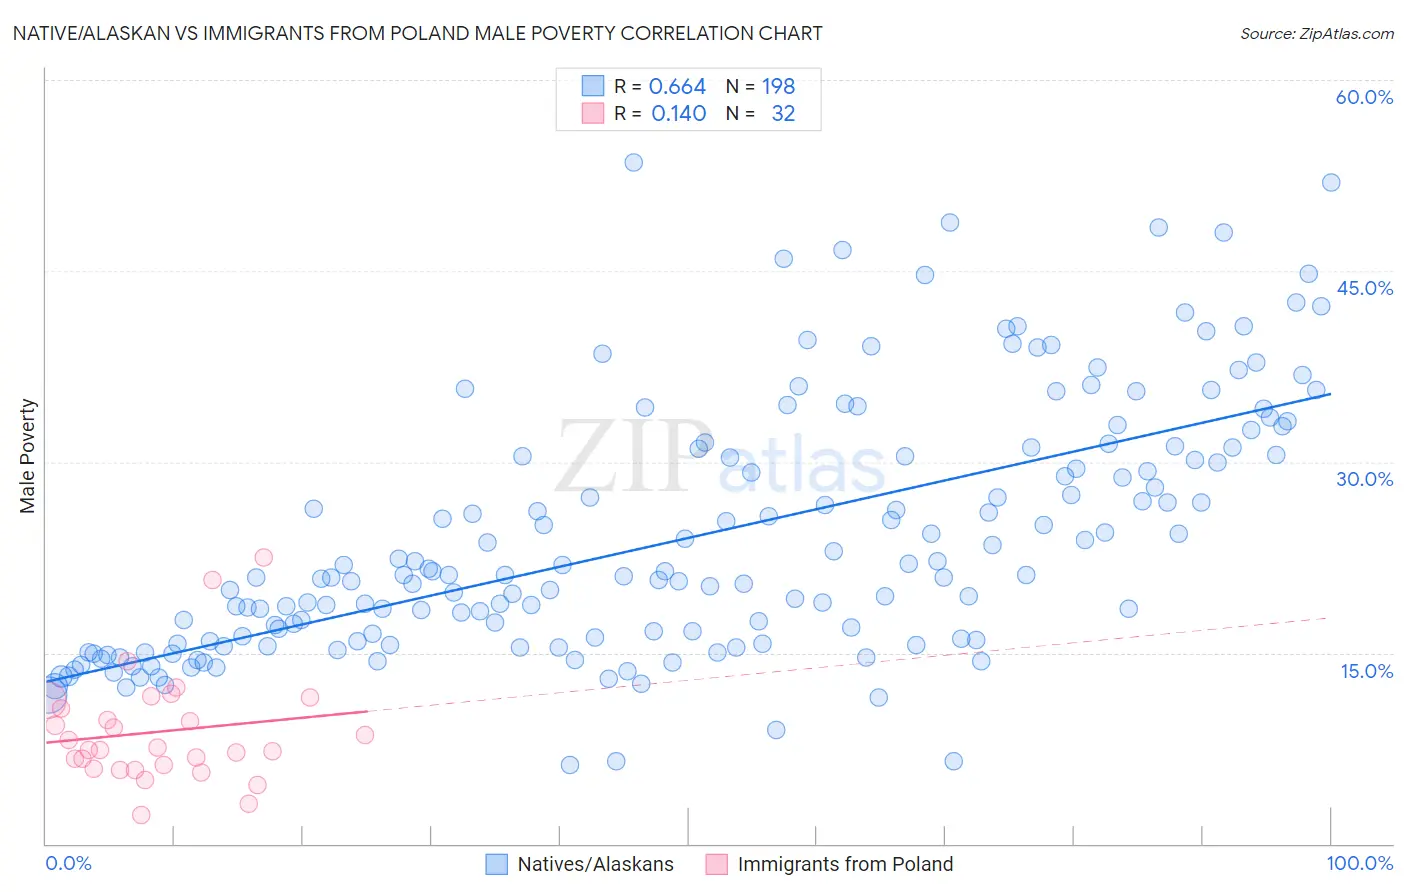
Native/Alaskan vs Immigrants from Poland Male Poverty Correlation Chart
The statistical analysis conducted on geographies consisting of 512,413,000 people shows a significant positive correlation between the proportion of Natives/Alaskans and poverty level among males in the United States with a correlation coefficient (R) of 0.664 and weighted average of 16.9%. Similarly, the statistical analysis conducted on geographies consisting of 304,660,101 people shows a poor positive correlation between the proportion of Immigrants from Poland and poverty level among males in the United States with a correlation coefficient (R) of 0.140 and weighted average of 9.8%, a difference of 73.5%.
Male Poverty Correlation Summary
| Measurement | Native/Alaskan | Immigrants from Poland |
| Minimum | 6.2% | 2.3% |
| Maximum | 53.5% | 22.5% |
| Range | 47.3% | 20.2% |
| Mean | 24.0% | 8.8% |
| Median | 21.1% | 7.5% |
| Interquartile 25% (IQ1) | 16.0% | 6.0% |
| Interquartile 75% (IQ3) | 30.5% | 11.0% |
| Interquartile Range (IQR) | 14.6% | 4.9% |
| Standard Deviation (Sample) | 9.9% | 4.3% |
| Standard Deviation (Population) | 9.9% | 4.3% |
Similar Demographics by Male Poverty
Demographics Similar to Natives/Alaskans by Male Poverty
In terms of male poverty, the demographic groups most similar to Natives/Alaskans are Houma (16.7%, a difference of 1.2%), Cheyenne (17.6%, a difference of 4.2%), Ute (16.2%, a difference of 4.2%), Apache (17.7%, a difference of 4.4%), and Immigrants from Dominican Republic (16.2%, a difference of 4.6%).
| Demographics | Rating | Rank | Male Poverty |
| Central American Indians | 0.0 /100 | #326 | Tragic 15.3% |
| Paiute | 0.0 /100 | #327 | Tragic 15.8% |
| Blacks/African Americans | 0.0 /100 | #328 | Tragic 15.8% |
| Dominicans | 0.0 /100 | #329 | Tragic 16.1% |
| Immigrants | Dominican Republic | 0.0 /100 | #330 | Tragic 16.2% |
| Ute | 0.0 /100 | #331 | Tragic 16.2% |
| Houma | 0.0 /100 | #332 | Tragic 16.7% |
| Natives/Alaskans | 0.0 /100 | #333 | Tragic 16.9% |
| Cheyenne | 0.0 /100 | #334 | Tragic 17.6% |
| Apache | 0.0 /100 | #335 | Tragic 17.7% |
| Pueblo | 0.0 /100 | #336 | Tragic 18.5% |
| Sioux | 0.0 /100 | #337 | Tragic 18.7% |
| Crow | 0.0 /100 | #338 | Tragic 19.1% |
| Yuman | 0.0 /100 | #339 | Tragic 19.5% |
| Immigrants | Yemen | 0.0 /100 | #340 | Tragic 20.1% |
Demographics Similar to Immigrants from Poland by Male Poverty
In terms of male poverty, the demographic groups most similar to Immigrants from Poland are Immigrants from Northern Europe (9.7%, a difference of 0.15%), Macedonian (9.7%, a difference of 0.23%), Iranian (9.8%, a difference of 0.30%), Czech (9.8%, a difference of 0.39%), and Tongan (9.7%, a difference of 0.44%).
| Demographics | Rating | Rank | Male Poverty |
| Danes | 99.6 /100 | #27 | Exceptional 9.7% |
| Immigrants | Korea | 99.6 /100 | #28 | Exceptional 9.7% |
| Greeks | 99.6 /100 | #29 | Exceptional 9.7% |
| Poles | 99.5 /100 | #30 | Exceptional 9.7% |
| Tongans | 99.5 /100 | #31 | Exceptional 9.7% |
| Macedonians | 99.5 /100 | #32 | Exceptional 9.7% |
| Immigrants | Northern Europe | 99.5 /100 | #33 | Exceptional 9.7% |
| Immigrants | Poland | 99.5 /100 | #34 | Exceptional 9.8% |
| Iranians | 99.4 /100 | #35 | Exceptional 9.8% |
| Czechs | 99.4 /100 | #36 | Exceptional 9.8% |
| Immigrants | Greece | 99.3 /100 | #37 | Exceptional 9.8% |
| Immigrants | Pakistan | 99.2 /100 | #38 | Exceptional 9.9% |
| Russians | 99.2 /100 | #39 | Exceptional 9.9% |
| Cypriots | 99.2 /100 | #40 | Exceptional 9.9% |
| Koreans | 99.2 /100 | #41 | Exceptional 9.9% |