Native/Alaskan vs Lebanese Child Poverty Among Girls Under 16
COMPARE
Native/Alaskan
Lebanese
Child Poverty Among Girls Under 16
Child Poverty Among Girls Under 16 Comparison
Natives/Alaskans
Lebanese
24.0%
CHILD POVERTY AMONG GIRLS UNDER 16
0.0/ 100
METRIC RATING
332nd/ 347
METRIC RANK
16.6%
CHILD POVERTY AMONG GIRLS UNDER 16
45.4/ 100
METRIC RATING
175th/ 347
METRIC RANK
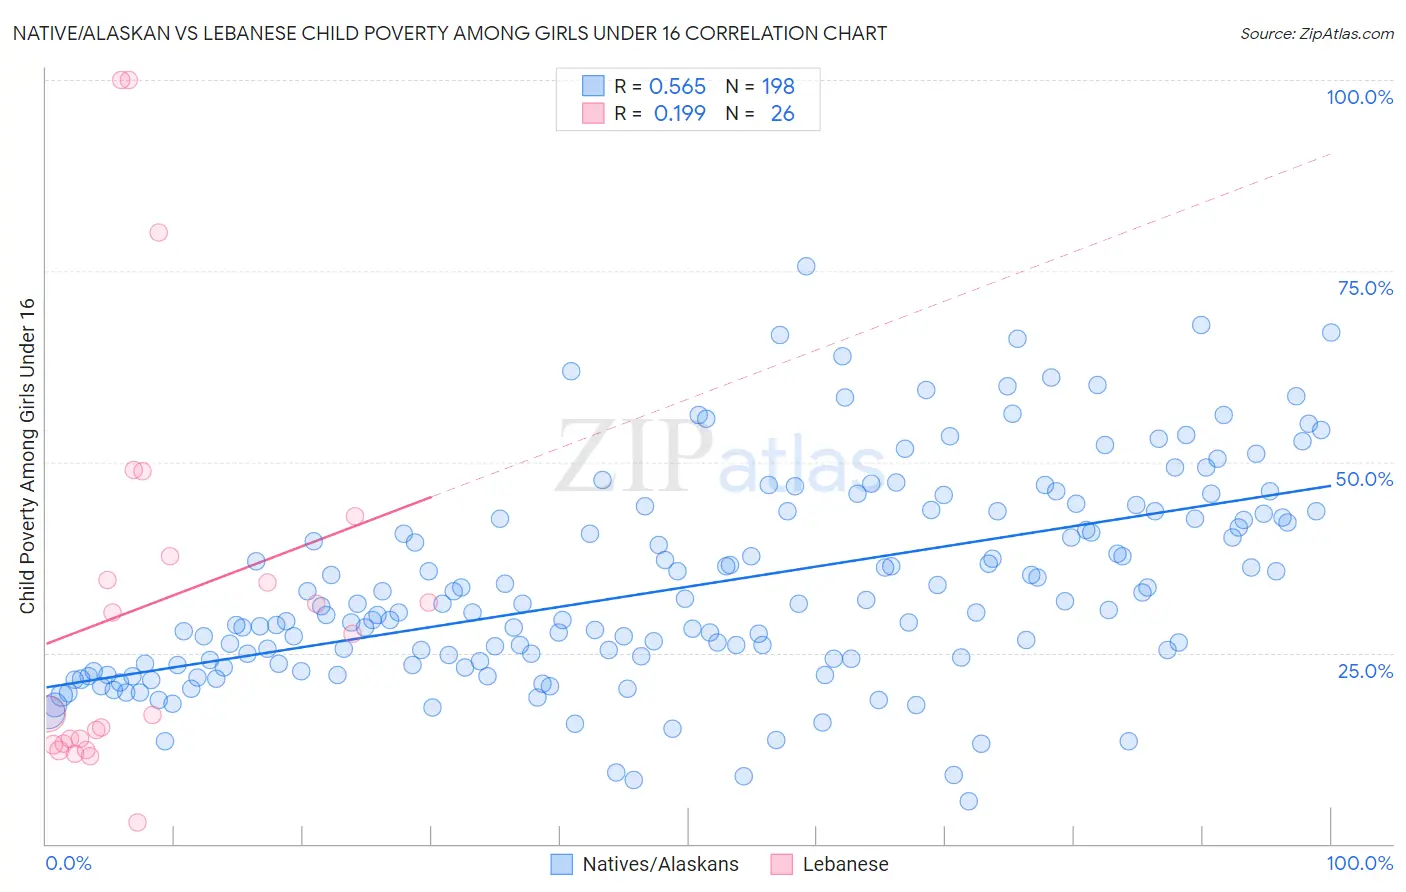
Native/Alaskan vs Lebanese Child Poverty Among Girls Under 16 Correlation Chart
The statistical analysis conducted on geographies consisting of 501,562,202 people shows a substantial positive correlation between the proportion of Natives/Alaskans and poverty level among girls under the age of 16 in the United States with a correlation coefficient (R) of 0.565 and weighted average of 24.0%. Similarly, the statistical analysis conducted on geographies consisting of 392,919,578 people shows a poor positive correlation between the proportion of Lebanese and poverty level among girls under the age of 16 in the United States with a correlation coefficient (R) of 0.199 and weighted average of 16.6%, a difference of 45.2%.
Child Poverty Among Girls Under 16 Correlation Summary
| Measurement | Native/Alaskan | Lebanese |
| Minimum | 5.5% | 2.8% |
| Maximum | 75.5% | 100.0% |
| Range | 70.0% | 97.2% |
| Mean | 33.7% | 31.4% |
| Median | 30.5% | 22.3% |
| Interquartile 25% (IQ1) | 23.6% | 13.2% |
| Interquartile 75% (IQ3) | 42.8% | 37.7% |
| Interquartile Range (IQR) | 19.2% | 24.5% |
| Standard Deviation (Sample) | 13.6% | 26.2% |
| Standard Deviation (Population) | 13.5% | 25.7% |
Similar Demographics by Child Poverty Among Girls Under 16
Demographics Similar to Natives/Alaskans by Child Poverty Among Girls Under 16
In terms of child poverty among girls under 16, the demographic groups most similar to Natives/Alaskans are Apache (23.8%, a difference of 0.86%), Immigrants from Dominican Republic (23.8%, a difference of 0.91%), Kiowa (23.7%, a difference of 1.5%), Dominican (23.7%, a difference of 1.6%), and Black/African American (24.7%, a difference of 2.5%).
| Demographics | Rating | Rank | Child Poverty Among Girls Under 16 |
| Immigrants | Congo | 0.0 /100 | #325 | Tragic 22.7% |
| Immigrants | Honduras | 0.0 /100 | #326 | Tragic 22.8% |
| Central American Indians | 0.0 /100 | #327 | Tragic 22.8% |
| Dominicans | 0.0 /100 | #328 | Tragic 23.7% |
| Kiowa | 0.0 /100 | #329 | Tragic 23.7% |
| Immigrants | Dominican Republic | 0.0 /100 | #330 | Tragic 23.8% |
| Apache | 0.0 /100 | #331 | Tragic 23.8% |
| Natives/Alaskans | 0.0 /100 | #332 | Tragic 24.0% |
| Blacks/African Americans | 0.0 /100 | #333 | Tragic 24.7% |
| Menominee | 0.0 /100 | #334 | Tragic 25.0% |
| Pueblo | 0.0 /100 | #335 | Tragic 25.2% |
| Sioux | 0.0 /100 | #336 | Tragic 25.6% |
| Yup'ik | 0.0 /100 | #337 | Tragic 25.8% |
| Cheyenne | 0.0 /100 | #338 | Tragic 26.3% |
| Crow | 0.0 /100 | #339 | Tragic 26.4% |
Demographics Similar to Lebanese by Child Poverty Among Girls Under 16
In terms of child poverty among girls under 16, the demographic groups most similar to Lebanese are Hungarian (16.6%, a difference of 0.030%), Immigrants from Western Asia (16.6%, a difference of 0.15%), White/Caucasian (16.6%, a difference of 0.20%), Hawaiian (16.6%, a difference of 0.23%), and Immigrants from Syria (16.6%, a difference of 0.24%).
| Demographics | Rating | Rank | Child Poverty Among Girls Under 16 |
| Yugoslavians | 64.4 /100 | #168 | Good 16.2% |
| Costa Ricans | 64.2 /100 | #169 | Good 16.2% |
| Immigrants | Venezuela | 64.2 /100 | #170 | Good 16.2% |
| Immigrants | Saudi Arabia | 64.0 /100 | #171 | Good 16.2% |
| Afghans | 62.3 /100 | #172 | Good 16.2% |
| Immigrants | South America | 55.1 /100 | #173 | Average 16.4% |
| Ethiopians | 50.0 /100 | #174 | Average 16.5% |
| Lebanese | 45.4 /100 | #175 | Average 16.6% |
| Hungarians | 45.1 /100 | #176 | Average 16.6% |
| Immigrants | Western Asia | 44.1 /100 | #177 | Average 16.6% |
| Whites/Caucasians | 43.6 /100 | #178 | Average 16.6% |
| Hawaiians | 43.4 /100 | #179 | Average 16.6% |
| Immigrants | Syria | 43.3 /100 | #180 | Average 16.6% |
| Immigrants | Iraq | 43.2 /100 | #181 | Average 16.6% |
| Immigrants | Ethiopia | 43.1 /100 | #182 | Average 16.6% |