Czech vs Lebanese Child Poverty Among Girls Under 16
COMPARE
Czech
Lebanese
Child Poverty Among Girls Under 16
Child Poverty Among Girls Under 16 Comparison
Czechs
Lebanese
14.2%
CHILD POVERTY AMONG GIRLS UNDER 16
99.3/ 100
METRIC RATING
48th/ 347
METRIC RANK
16.6%
CHILD POVERTY AMONG GIRLS UNDER 16
45.4/ 100
METRIC RATING
175th/ 347
METRIC RANK
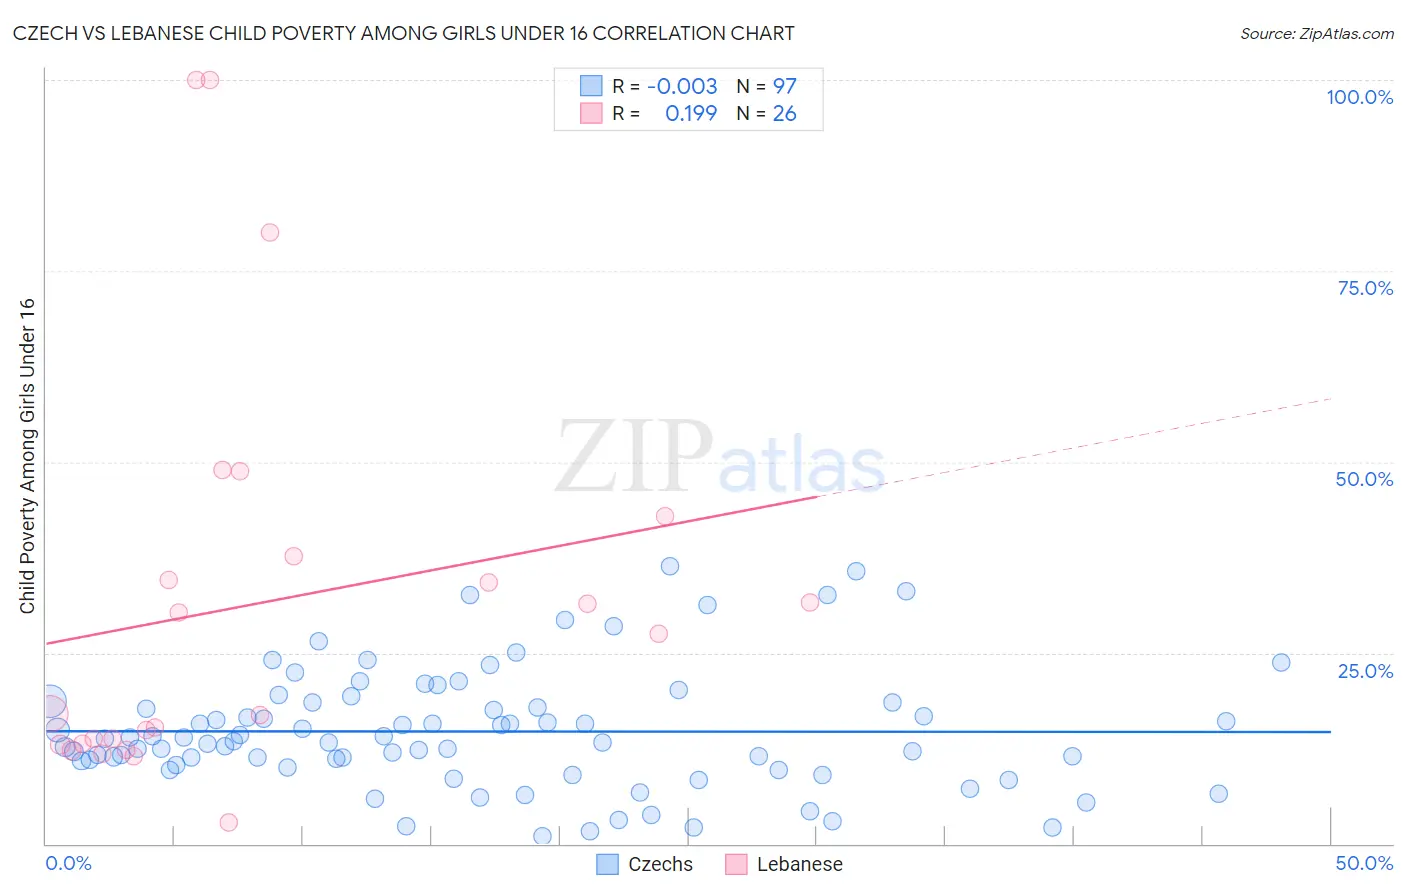
Czech vs Lebanese Child Poverty Among Girls Under 16 Correlation Chart
The statistical analysis conducted on geographies consisting of 470,185,036 people shows no correlation between the proportion of Czechs and poverty level among girls under the age of 16 in the United States with a correlation coefficient (R) of -0.003 and weighted average of 14.2%. Similarly, the statistical analysis conducted on geographies consisting of 392,919,578 people shows a poor positive correlation between the proportion of Lebanese and poverty level among girls under the age of 16 in the United States with a correlation coefficient (R) of 0.199 and weighted average of 16.6%, a difference of 17.0%.
Child Poverty Among Girls Under 16 Correlation Summary
| Measurement | Czech | Lebanese |
| Minimum | 0.95% | 2.8% |
| Maximum | 36.4% | 100.0% |
| Range | 35.4% | 97.2% |
| Mean | 14.7% | 31.4% |
| Median | 13.5% | 22.3% |
| Interquartile 25% (IQ1) | 10.1% | 13.2% |
| Interquartile 75% (IQ3) | 18.5% | 37.7% |
| Interquartile Range (IQR) | 8.4% | 24.5% |
| Standard Deviation (Sample) | 7.8% | 26.2% |
| Standard Deviation (Population) | 7.8% | 25.7% |
Similar Demographics by Child Poverty Among Girls Under 16
Demographics Similar to Czechs by Child Poverty Among Girls Under 16
In terms of child poverty among girls under 16, the demographic groups most similar to Czechs are Immigrants from Czechoslovakia (14.2%, a difference of 0.020%), Croatian (14.1%, a difference of 0.040%), Greek (14.2%, a difference of 0.040%), Immigrants from Greece (14.1%, a difference of 0.070%), and Immigrants from Israel (14.2%, a difference of 0.11%).
| Demographics | Rating | Rank | Child Poverty Among Girls Under 16 |
| Immigrants | Bolivia | 99.5 /100 | #41 | Exceptional 14.0% |
| Immigrants | Scotland | 99.4 /100 | #42 | Exceptional 14.0% |
| Koreans | 99.4 /100 | #43 | Exceptional 14.1% |
| Immigrants | Asia | 99.4 /100 | #44 | Exceptional 14.1% |
| Immigrants | Greece | 99.3 /100 | #45 | Exceptional 14.1% |
| Croatians | 99.3 /100 | #46 | Exceptional 14.1% |
| Immigrants | Czechoslovakia | 99.3 /100 | #47 | Exceptional 14.2% |
| Czechs | 99.3 /100 | #48 | Exceptional 14.2% |
| Greeks | 99.2 /100 | #49 | Exceptional 14.2% |
| Immigrants | Israel | 99.2 /100 | #50 | Exceptional 14.2% |
| Immigrants | Pakistan | 99.1 /100 | #51 | Exceptional 14.2% |
| Italians | 99.1 /100 | #52 | Exceptional 14.3% |
| Luxembourgers | 99.0 /100 | #53 | Exceptional 14.3% |
| Estonians | 98.9 /100 | #54 | Exceptional 14.3% |
| Immigrants | Romania | 98.9 /100 | #55 | Exceptional 14.3% |
Demographics Similar to Lebanese by Child Poverty Among Girls Under 16
In terms of child poverty among girls under 16, the demographic groups most similar to Lebanese are Hungarian (16.6%, a difference of 0.030%), Immigrants from Western Asia (16.6%, a difference of 0.15%), White/Caucasian (16.6%, a difference of 0.20%), Hawaiian (16.6%, a difference of 0.23%), and Immigrants from Syria (16.6%, a difference of 0.24%).
| Demographics | Rating | Rank | Child Poverty Among Girls Under 16 |
| Yugoslavians | 64.4 /100 | #168 | Good 16.2% |
| Costa Ricans | 64.2 /100 | #169 | Good 16.2% |
| Immigrants | Venezuela | 64.2 /100 | #170 | Good 16.2% |
| Immigrants | Saudi Arabia | 64.0 /100 | #171 | Good 16.2% |
| Afghans | 62.3 /100 | #172 | Good 16.2% |
| Immigrants | South America | 55.1 /100 | #173 | Average 16.4% |
| Ethiopians | 50.0 /100 | #174 | Average 16.5% |
| Lebanese | 45.4 /100 | #175 | Average 16.6% |
| Hungarians | 45.1 /100 | #176 | Average 16.6% |
| Immigrants | Western Asia | 44.1 /100 | #177 | Average 16.6% |
| Whites/Caucasians | 43.6 /100 | #178 | Average 16.6% |
| Hawaiians | 43.4 /100 | #179 | Average 16.6% |
| Immigrants | Syria | 43.3 /100 | #180 | Average 16.6% |
| Immigrants | Iraq | 43.2 /100 | #181 | Average 16.6% |
| Immigrants | Ethiopia | 43.1 /100 | #182 | Average 16.6% |