Native/Alaskan vs Bolivian Child Poverty Among Girls Under 16
COMPARE
Native/Alaskan
Bolivian
Child Poverty Among Girls Under 16
Child Poverty Among Girls Under 16 Comparison
Natives/Alaskans
Bolivians
24.0%
CHILD POVERTY AMONG GIRLS UNDER 16
0.0/ 100
METRIC RATING
332nd/ 347
METRIC RANK
13.6%
CHILD POVERTY AMONG GIRLS UNDER 16
99.8/ 100
METRIC RATING
29th/ 347
METRIC RANK
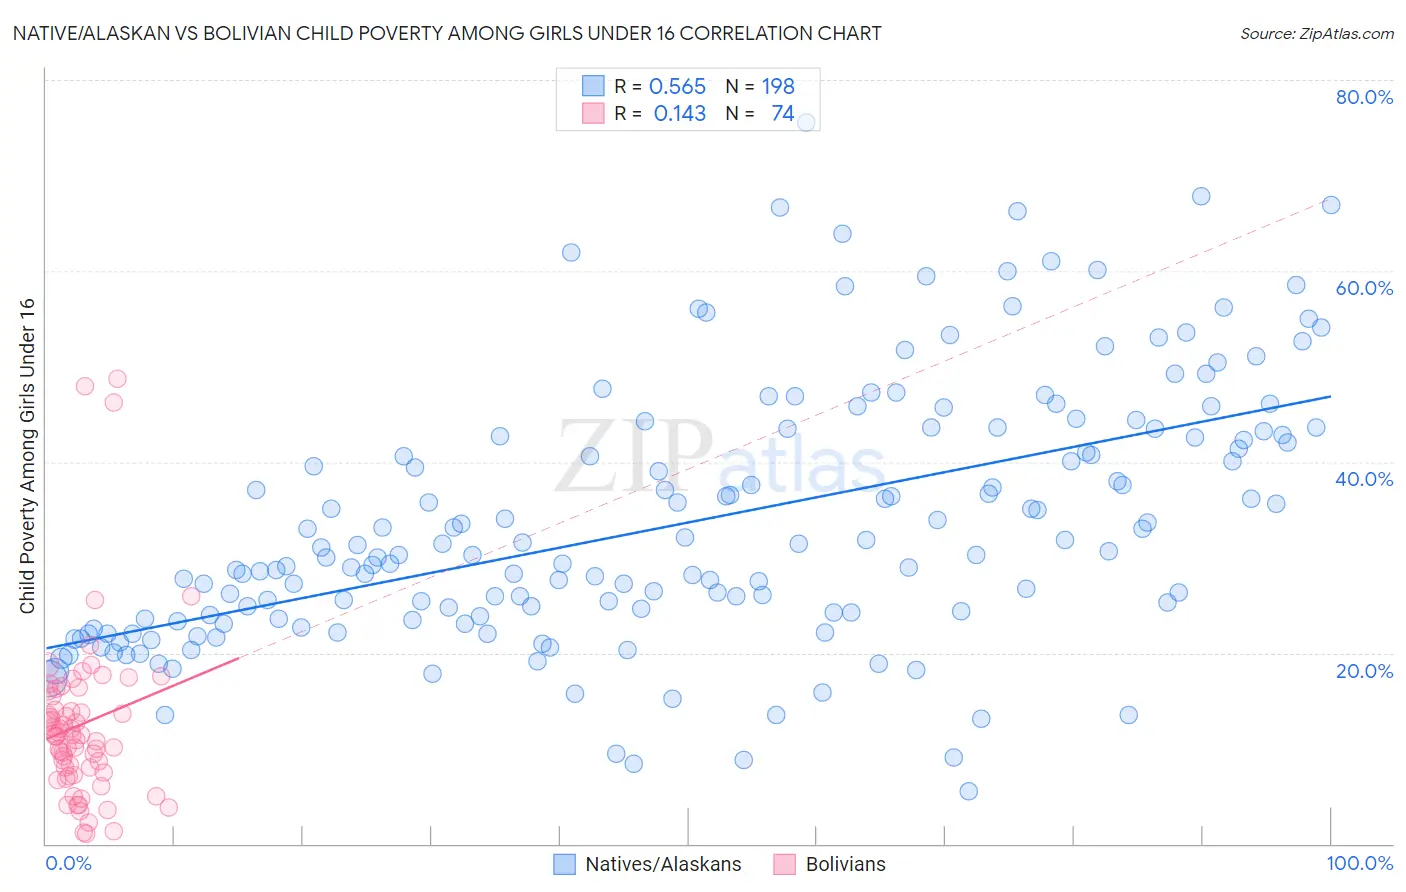
Native/Alaskan vs Bolivian Child Poverty Among Girls Under 16 Correlation Chart
The statistical analysis conducted on geographies consisting of 501,562,202 people shows a substantial positive correlation between the proportion of Natives/Alaskans and poverty level among girls under the age of 16 in the United States with a correlation coefficient (R) of 0.565 and weighted average of 24.0%. Similarly, the statistical analysis conducted on geographies consisting of 183,239,714 people shows a poor positive correlation between the proportion of Bolivians and poverty level among girls under the age of 16 in the United States with a correlation coefficient (R) of 0.143 and weighted average of 13.6%, a difference of 77.0%.
Child Poverty Among Girls Under 16 Correlation Summary
| Measurement | Native/Alaskan | Bolivian |
| Minimum | 5.5% | 1.0% |
| Maximum | 75.5% | 48.7% |
| Range | 70.0% | 47.7% |
| Mean | 33.7% | 12.5% |
| Median | 30.5% | 11.3% |
| Interquartile 25% (IQ1) | 23.6% | 7.5% |
| Interquartile 75% (IQ3) | 42.8% | 15.5% |
| Interquartile Range (IQR) | 19.2% | 8.1% |
| Standard Deviation (Sample) | 13.6% | 9.0% |
| Standard Deviation (Population) | 13.5% | 8.9% |
Similar Demographics by Child Poverty Among Girls Under 16
Demographics Similar to Natives/Alaskans by Child Poverty Among Girls Under 16
In terms of child poverty among girls under 16, the demographic groups most similar to Natives/Alaskans are Apache (23.8%, a difference of 0.86%), Immigrants from Dominican Republic (23.8%, a difference of 0.91%), Kiowa (23.7%, a difference of 1.5%), Dominican (23.7%, a difference of 1.6%), and Black/African American (24.7%, a difference of 2.5%).
| Demographics | Rating | Rank | Child Poverty Among Girls Under 16 |
| Immigrants | Congo | 0.0 /100 | #325 | Tragic 22.7% |
| Immigrants | Honduras | 0.0 /100 | #326 | Tragic 22.8% |
| Central American Indians | 0.0 /100 | #327 | Tragic 22.8% |
| Dominicans | 0.0 /100 | #328 | Tragic 23.7% |
| Kiowa | 0.0 /100 | #329 | Tragic 23.7% |
| Immigrants | Dominican Republic | 0.0 /100 | #330 | Tragic 23.8% |
| Apache | 0.0 /100 | #331 | Tragic 23.8% |
| Natives/Alaskans | 0.0 /100 | #332 | Tragic 24.0% |
| Blacks/African Americans | 0.0 /100 | #333 | Tragic 24.7% |
| Menominee | 0.0 /100 | #334 | Tragic 25.0% |
| Pueblo | 0.0 /100 | #335 | Tragic 25.2% |
| Sioux | 0.0 /100 | #336 | Tragic 25.6% |
| Yup'ik | 0.0 /100 | #337 | Tragic 25.8% |
| Cheyenne | 0.0 /100 | #338 | Tragic 26.3% |
| Crow | 0.0 /100 | #339 | Tragic 26.4% |
Demographics Similar to Bolivians by Child Poverty Among Girls Under 16
In terms of child poverty among girls under 16, the demographic groups most similar to Bolivians are Tongan (13.6%, a difference of 0.12%), Latvian (13.5%, a difference of 0.38%), Eastern European (13.5%, a difference of 0.40%), Asian (13.7%, a difference of 0.67%), and Turkish (13.7%, a difference of 0.79%).
| Demographics | Rating | Rank | Child Poverty Among Girls Under 16 |
| Indians (Asian) | 99.9 /100 | #22 | Exceptional 13.3% |
| Norwegians | 99.9 /100 | #23 | Exceptional 13.3% |
| Immigrants | Eastern Asia | 99.9 /100 | #24 | Exceptional 13.4% |
| Immigrants | China | 99.8 /100 | #25 | Exceptional 13.4% |
| Eastern Europeans | 99.8 /100 | #26 | Exceptional 13.5% |
| Latvians | 99.8 /100 | #27 | Exceptional 13.5% |
| Tongans | 99.8 /100 | #28 | Exceptional 13.6% |
| Bolivians | 99.8 /100 | #29 | Exceptional 13.6% |
| Asians | 99.7 /100 | #30 | Exceptional 13.7% |
| Turks | 99.7 /100 | #31 | Exceptional 13.7% |
| Danes | 99.7 /100 | #32 | Exceptional 13.7% |
| Swedes | 99.7 /100 | #33 | Exceptional 13.7% |
| Maltese | 99.7 /100 | #34 | Exceptional 13.7% |
| Immigrants | Northern Europe | 99.6 /100 | #35 | Exceptional 13.8% |
| Russians | 99.6 /100 | #36 | Exceptional 13.9% |